

 Marcel Pękala
This week, we're grateful to Marcel Pękala, who shows how the same Sitebulb crawl that powers a technical audit can be turned into a topical-focus analysis of your own domain—measuring which pages drift from your site's core, and cross-checking against Search Console before anything gets pruned.
The same Sitebulb crawl that powers our technical audits answered a content strategy question: how thematically coherent is our site, and which pages blur that focus?
I'm Marcel Pękala, SEO specialist at FEB, an e-commerce marketing agency from Poland. We ran this experiment on our own domain. We exported the full text of 850 pages, cleaned the export down to 767 unique pages, turned each one into a vector with gemini-embedding-2, and calculated two metrics: Site Focus for the domain (0.85 in our case) and Site Radius for every page. The whole run cost well under a dollar of API usage and produced a shortlist of pages that no classic report had ever flagged.
Below is the entire process, step by step – from the Content Extraction setup in Sitebulb, through a Python script, to the decisions we made based on Google Search Console data. Everything here is replicable with a Sitebulb licence, a Gemini API key and one afternoon.
Contents:
- Why measure the topical focus of your own domain?
- Step 1: getting the full page text out of Sitebulb
- Step 2: cleaning the export before it touches the model
- Step 3: turning pages into vectors
- Step 4: Site Focus and Site Radius
- Step 5: visualising the domain
- What we found: the marketing glossary as a double-edged sword
- The centre of the map is a sanity check
- GSC verification before calling anything pruning
- Why not just use the built-in tools?
- Caveats
- How to replicate it on your own site
Why measure the topical focus of your own domain?
We wanted to answer one question: does our site "talk" about one subject, or about a dozen at once?
Content accumulates on a domain over the years – blog posts, service pages, a marketing glossary, case studies. Each page was created for a reason, but nobody ever looks at them collectively and asks whether they still add up to a coherent picture of what the business does.
This is also a semantic SEO question, not just housekeeping. Search engines model a domain as an entity with a central topic and reward sites that build deep, interconnected coverage around that identity – topical authority – over sites that scatter across unrelated subjects.
And this is not hypothetical: the 2024 leak of Google's Content Warehouse API documentation revealed attributes named siteFocusScore and siteRadius – a stored measure of how much a site concentrates on one topic and how far each page drifts from that core. The metrics in this article borrow their names from those attributes, because they try to approximate the same judgement from the outside.
Embeddings let you measure this instead of guessing. If every page can be represented as a vector of meaning, then the whole domain has a "centre of gravity" – the centroid. The distance between a page and the centroid tells you how far that page strays from the site's core topic. And the crawl we run in Sitebulb for every audit already contains everything needed as input.
Step 1: getting the full page text out of Sitebulb
Sitebulb collects the main content of every page through Content Extraction – a setting you configure in Audit settings before starting the crawl.
Find out how to use Sitebulb Content Search & Extraction here.
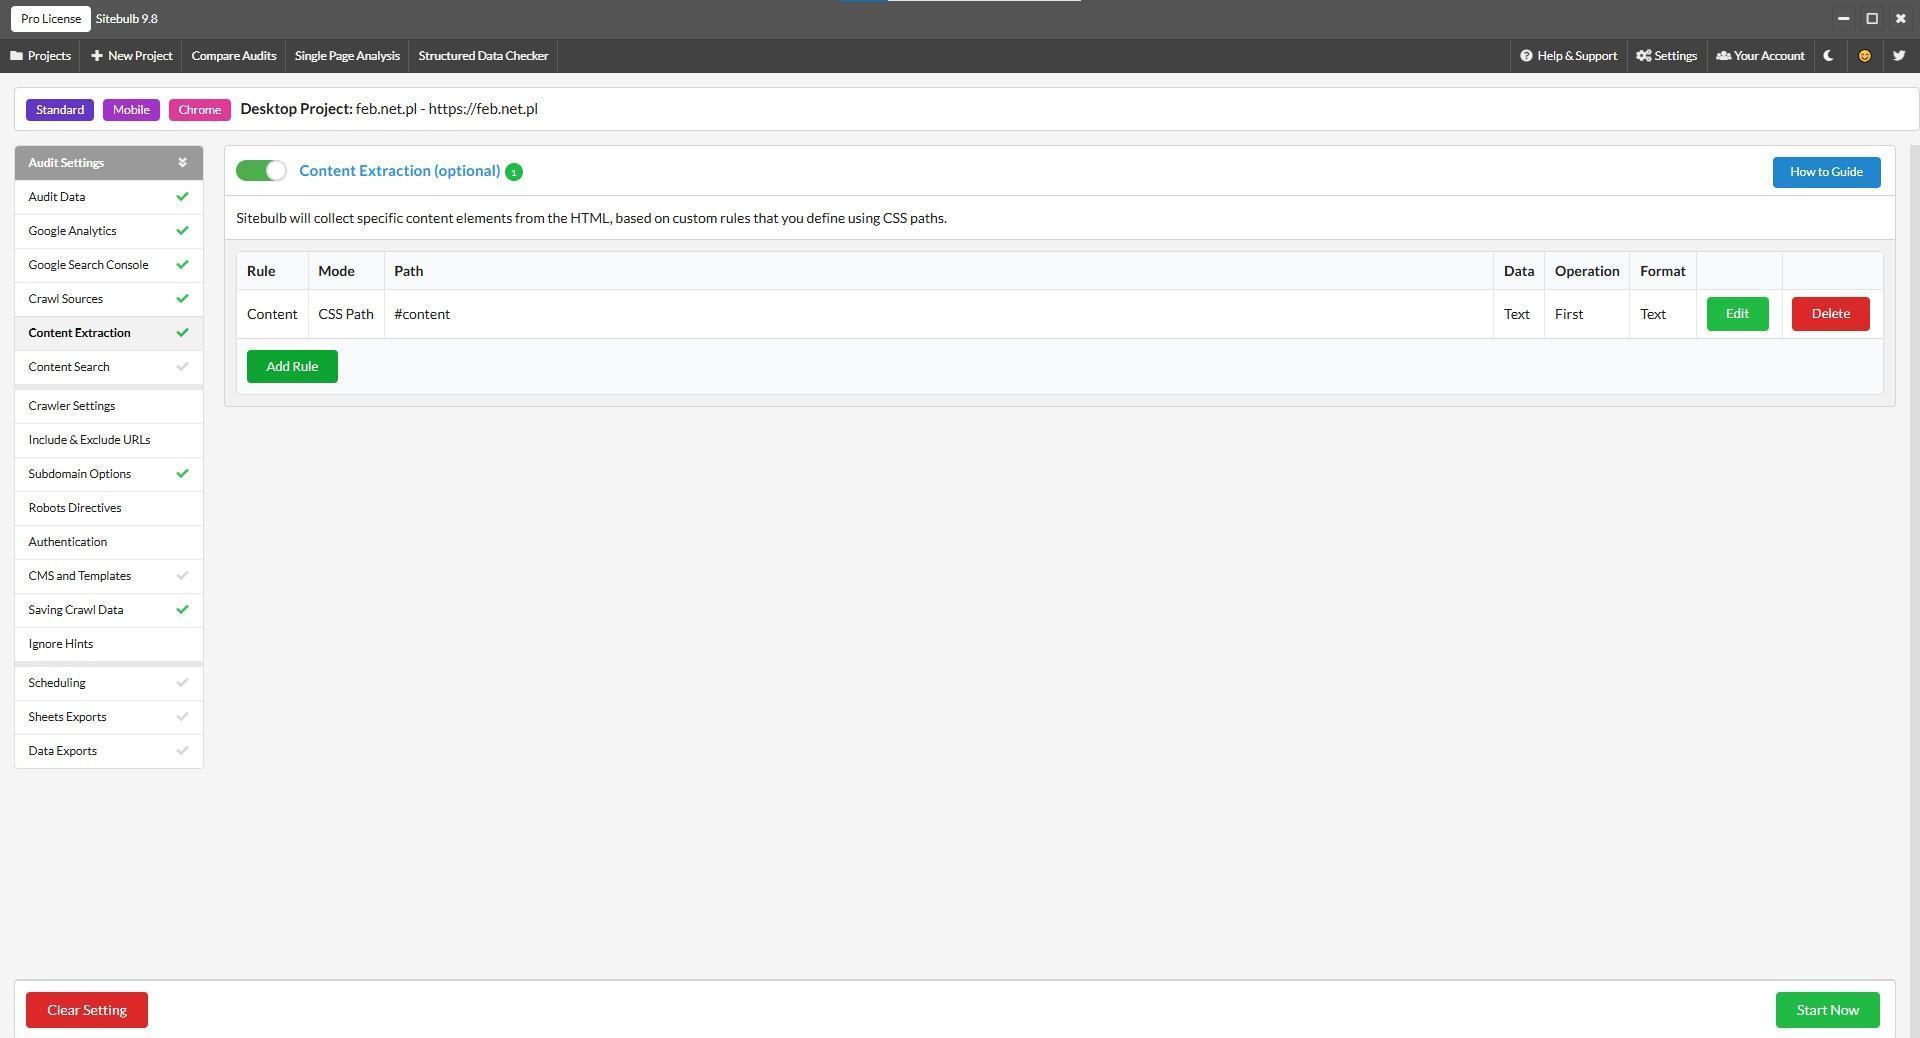
You add a rule with the CSS selector of your main content container and choose to extract the data as text. In our case the selector was #content, with "Text" as the extraction format (inner text, not HTML). This way the analysis receives only what a user actually reads – no navigation, no footer, no code.

The screenshot below shows you the desired outcome.
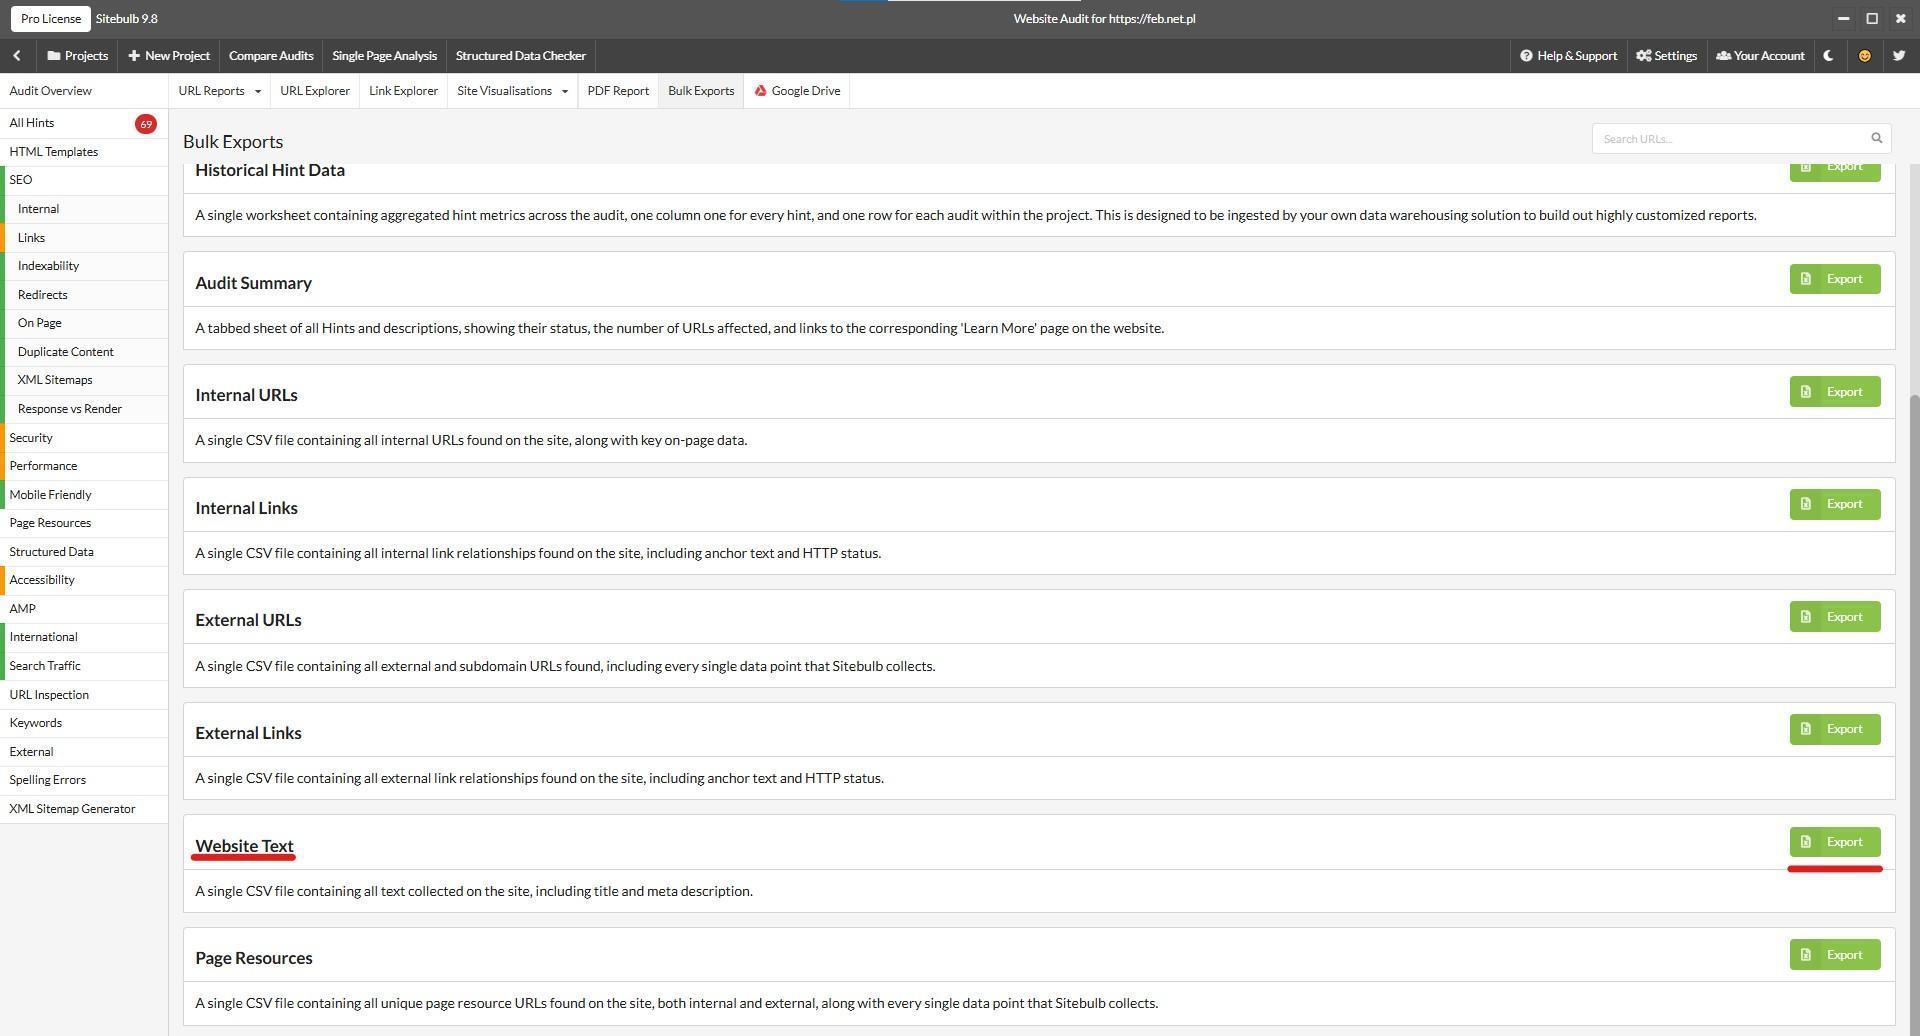
After crawling the domain, the export is a single button. The Bulk Exports tab includes a Website Text report – one CSV file with all the collected text, including titles and meta descriptions. That gave us a file with URL, Title, Meta Description and Text columns for 850 pages.
Step 2: cleaning the export before it touches the model
A crawl export is not yet a dataset. Before computing anything, the script removes the pages that would enter the centroid more than once – or should not enter it at all.
Three things came out of our 850 rows. First, 82 URLs were query-string variants of pages that also existed in a clean form (a single builder_gallery parameter, a leftover of the page builder). Same content, different URL – left in place, each of those pages would pull the centroid towards itself twice. The script drops every URL containing "?" after checking that a clean twin exists, so no content is lost.
Second, one page had 25 characters of extractable text (the cookie-preferences page) – below our 50-character minimum, an embedding of it would describe noise, so it goes.
Third, the script flags three pairs of pages with byte-identical content under different paths – kept, but reported: that is a finding about the site, not the method.
df[URL_COLUMN] = df[URL_COLUMN].astype(str)

if DROP_QUERY_URLS:
    is_query = df[URL_COLUMN].str.contains(r"\?", regex=True)
    variants = df.loc[is_query, URL_COLUMN]
    params = sorted({v.split("?", 1)[1].split("=")[0] for v in variants}) if len(variants) else []
    print(f"URLs containing '?': {int(is_query.sum())}")
    print(f"Parameters seen    : {', '.join(params) if params else '(none)'}")

    # safety check: would dropping these lose any page entirely?
    bases   = {u.split("?", 1)[0].rstrip("/") for u in variants}
    plain   = {u.rstrip("/") for u in df.loc[~is_query, URL_COLUMN]}
    orphans = bases - plain
    if orphans:
        print(f"WARNING: {len(orphans)} page(s) exist ONLY as a '?' variant and will be lost:")
        for u in sorted(orphans):
            print("   ", u)
    else:
        print("Check OK: every dropped variant has a plain equivalent — nothing is lost.")
    df = df.loc[~is_query].copy()
    print(f"After dropping variants: {len(df)} pages ({n_start} -> {len(df)})")
That left 767 pages for the analysis. The lesson generalises: whatever crawler you use, look at what your export actually contains before averaging 850 vectors into one "site topic".
Step 3: turning pages into vectors
A Python script with the google-genai library and the gemini-embedding-2 model computes the embeddings – at the model's native 3,072 dimensions, task type SEMANTIC_SIMILARITY, with L2 normalisation of every vector.
Token limits deserve more paranoia than they usually get, because embedding models differ widely and their APIs do not enforce the limit loudly. gemini-embedding-001, for instance, accepts 2,048 tokens – a quarter of what gemini-embedding-2 takes. Feed either model too long a page and nothing errors: the API embeds the beginning, discards the rest, and returns a perfectly normal-looking vector.
The script therefore trusts nothing it can verify instead: the 8,192-token limit is read from the API itself rather than assumed, and trimming is driven by exact token accounting, not character heuristics. If you take one operational lesson from this article, take this one: verify the input limit programmatically, because an embedding API truncates silently, and a truncated embedding looks exactly like a real one.
The token accounting works in two stages to keep API calls down. Pages longer than a conservative character threshold (12,288 characters – 135 of our 767 pages) get an exact count_tokens call. Only 3 pages actually exceeded the 8,192-token limit: a WordPress SEO guide (12,174 tokens), an e-commerce SEO guide (8,574) and – of all things – the privacy policy (8,325). Those three are trimmed to exactly 8,192 tokens by bisection; everything else goes in whole. So we can answer precisely the question every reader should ask: did the long pages come through in full? All but three, and for those three we know the exact cut.
if over:
    print(f"\nTRUNCATING {len(over)} page(s) over the limit. Full list:")
    for i in over:
        before, text = int(df.at[i, "tokens"]), df.at[i, TEXT_COLUMN]
        lo, hi = 0, len(text)
        while lo < hi:                        # binary search on character count
            mid = (lo + hi + 1) // 2
            if count_tokens(text[:mid]) <= MAX_TOKENS:
                lo = mid
            else:
                hi = mid - 1
        df.at[i, TEXT_COLUMN] = text[:lo]
        after = count_tokens(text[:lo])
        truncated.append({"url": df.at[i, URL_COLUMN], "before": before, "after": after})
        print(f"    {before} -> {after} tokens   {df.at[i, URL_COLUMN]}")
else:
    print("\nNo page exceeds the limit — nothing is truncated.")
One more pitfall worth the ink: gemini-embedding-2 does not batch. Pass it a list of texts and it concatenates them into a single input rather than embedding them separately – so the script sends one page per call, ten calls in parallel. All 767 pages embedded in 42 seconds.
The screenshot below shows the part of the script worth pausing on: the API call itself. The embedding model, the task type and the dimensionality all enter here as variables, set once at the top of the script, followed by explicit L2 normalisation of each vector. Every one of these choices affects the distances you get at the end – and because they are variables rather than values buried in the call, they are easy to swap.
# ---- model ----------------------------------------------------------------
MODEL       = "gemini-embedding-2"    # 8,192 token input limit, 3,072 native dims
TASK_TYPE   = "SEMANTIC_SIMILARITY"   # the right task type for similarity work
EMBED_DIMS  = None                    # None = native 3072. Or set 768 / 1536 to shrink.
MAX_TOKENS  = 8192                    # model input limit — verified from the API below
WORKERS     = 5                       # parallel API calls — see the rate-limit note

def embed_one(text):
    """Embed a single text and return an L2-normalised float32 vector."""
    cfg = types.EmbedContentConfig(task_type=TASK_TYPE)
    if EMBED_DIMS:
        cfg = types.EmbedContentConfig(task_type=TASK_TYPE, output_dimensionality=EMBED_DIMS)
    r = with_retry(lambda: client.models.embed_content(model=MODEL, contents=text, config=cfg),
                   "embed_content")
    v = np.array(r.embeddings[0].values, dtype=np.float32)
    return v / np.linalg.norm(v)
Cost tends to be the first question with experiments like this, so let's state it plainly. Gemini API pricing puts gemini-embedding-2 at $0.20 per million input tokens ($0.10 via the batch API). Our full run consumed roughly 1.7 million tokens – about $0.35 at list price. In practice the constraint is not money but rate limits: on a bigger site, lower the number of parallel workers, or switch to an account with billing enabled and let it run flat out.
Step 4: Site Focus and Site Radius
The centroid is the mean of all page vectors – the "average topic" of the domain. A page's Site Radius is its cosine distance from the centroid, and the domain's Site Focus is 1/(1+AvgSiteRadius).
With L2-normalised vectors, cosine distance reduces to 1 minus the dot product, so the heart of the whole method fits in three lines of code.
That is exactly what the next code fragment shows: average the embeddings, normalise the result, subtract the dot products from 1. Behind a serious-sounding metric sits maths you could explain on a whiteboard in a minute. If the phrase "vector analysis of a domain" sounds intimidating, this fragment is the antidote.
Metric | 3,072d (native) | 768d (MRL) |
|---|---|---|
Pages analysed | 767 | 767 |
Site Focus | 0.8498 | 0.8545 |
Average Site Radius | 0.1768 | 0.1703 |
Median | 0.1608 | 0.1560 |
Standard deviation | 0.0457 | 0.0438 |
95th percentile | 0.2641 | 0.2541 |
Maximum | 0.3961 | 0.3792 |
centroid = embeddings.mean(axis=0)
centroid = centroid / np.linalg.norm(centroid)
radius = 1.0 - (embeddings @ centroid)
avg_radius = float(radius.mean())
site_focus = 1.0 / (1.0 + avg_radius)
Two things are worth reading out of that table before any interpretation. Every number comes straight from a small dictionary at the end of the script – there is no hidden post-processing between the embeddings and the figures quoted here, which makes the results easy to audit and easy to reproduce. And the two columns barely differ: cutting the dimensionality by three quarters moves Site Focus by half a point of the second decimal. If storage matters to you, 768 dimensions preserve the ranking almost intact.
metrics = {
    "Pages analysed":      len(df),
    "Site Focus":          round(site_focus, 4),
    "Average Site Radius": round(avg_radius, 4),
    "Median":              round(float(np.median(radius)), 4),
    "Standard deviation":  round(float(radius.std()), 4),
    "95th percentile":     round(float(np.percentile(radius, 95)), 4),
    "Maximum":             round(float(radius.max()), 4),
}
How to read the score itself? Absolute values shift with the embedding model, the dimension count and how much boilerplate your crawler captured, so treat any cross-domain comparison as directional – the leaked Google attributes come with no published scale, and neither do we have one. What we can offer is the working scale from our own runs, framed as exactly that – our experience, not a benchmark:
Site Focus | Reading |
|---|---|
above 0.90 | Very tightly specialised – a single-topic site |
0.85 – 0.90 | Strongly focused, with some peripheral sections |
0.75 – 0.85 | Broad but coherent – several related topics |
below 0.75 | Diffuse – often sponsored posts, a stale blog, or a merged site |
Our 0.85 lands at the bottom edge of "strongly focused, with some peripheral sections" – the domain sticks to its subject, and the peripheral sections are real. Which is exactly why the interesting part turned out to be the tails of the distribution. Both of them.
Step 5: visualising the domain
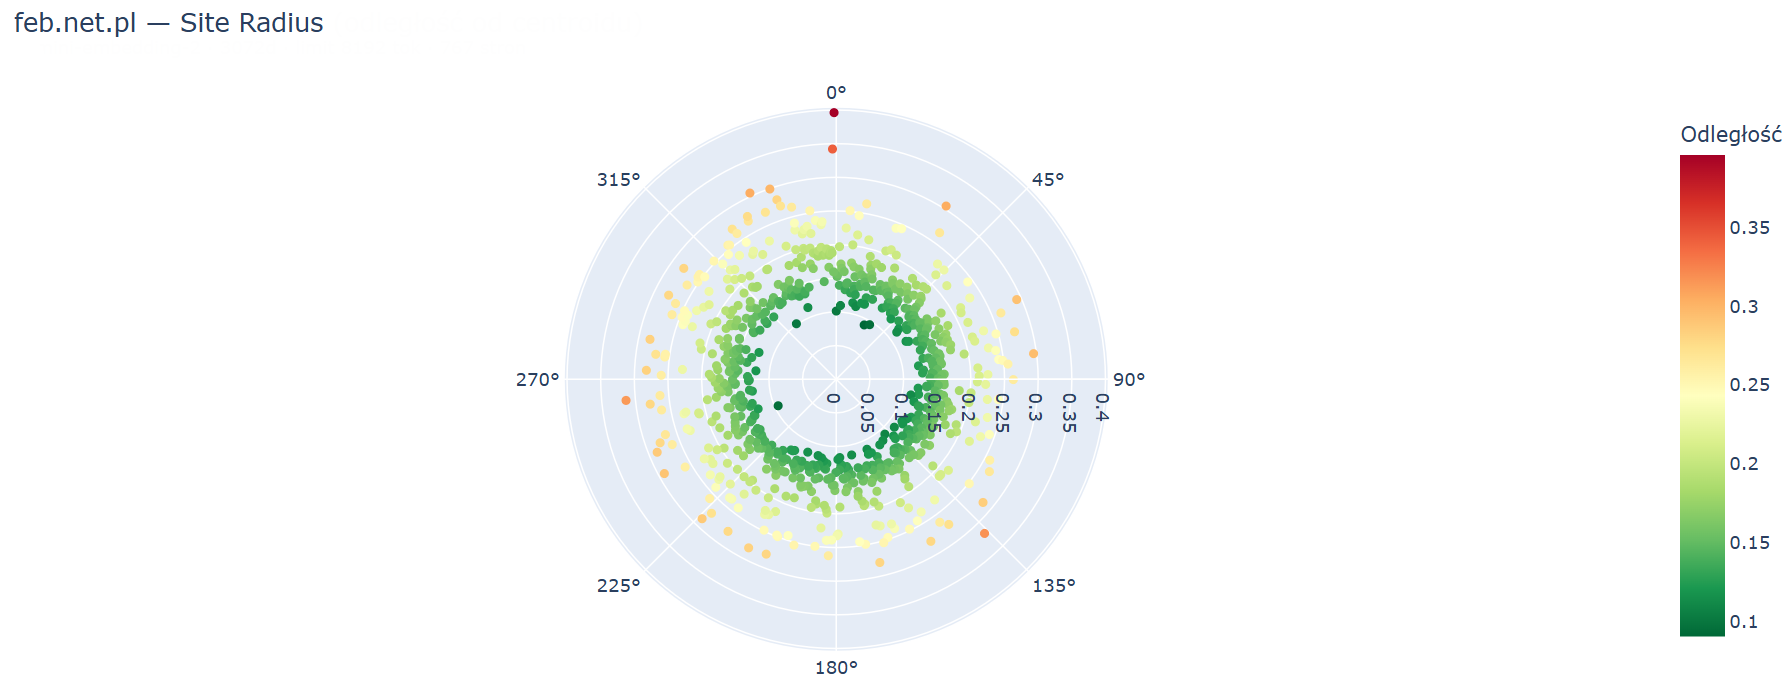
From the same data we built two interactive Plotly charts – a polar chart and a t-SNE map. The polar chart shows pages orbiting the thematic centre: the further from the middle, the higher the Site Radius. Colour carries the same information, so the outliers show up red at the rim without reading a single table.
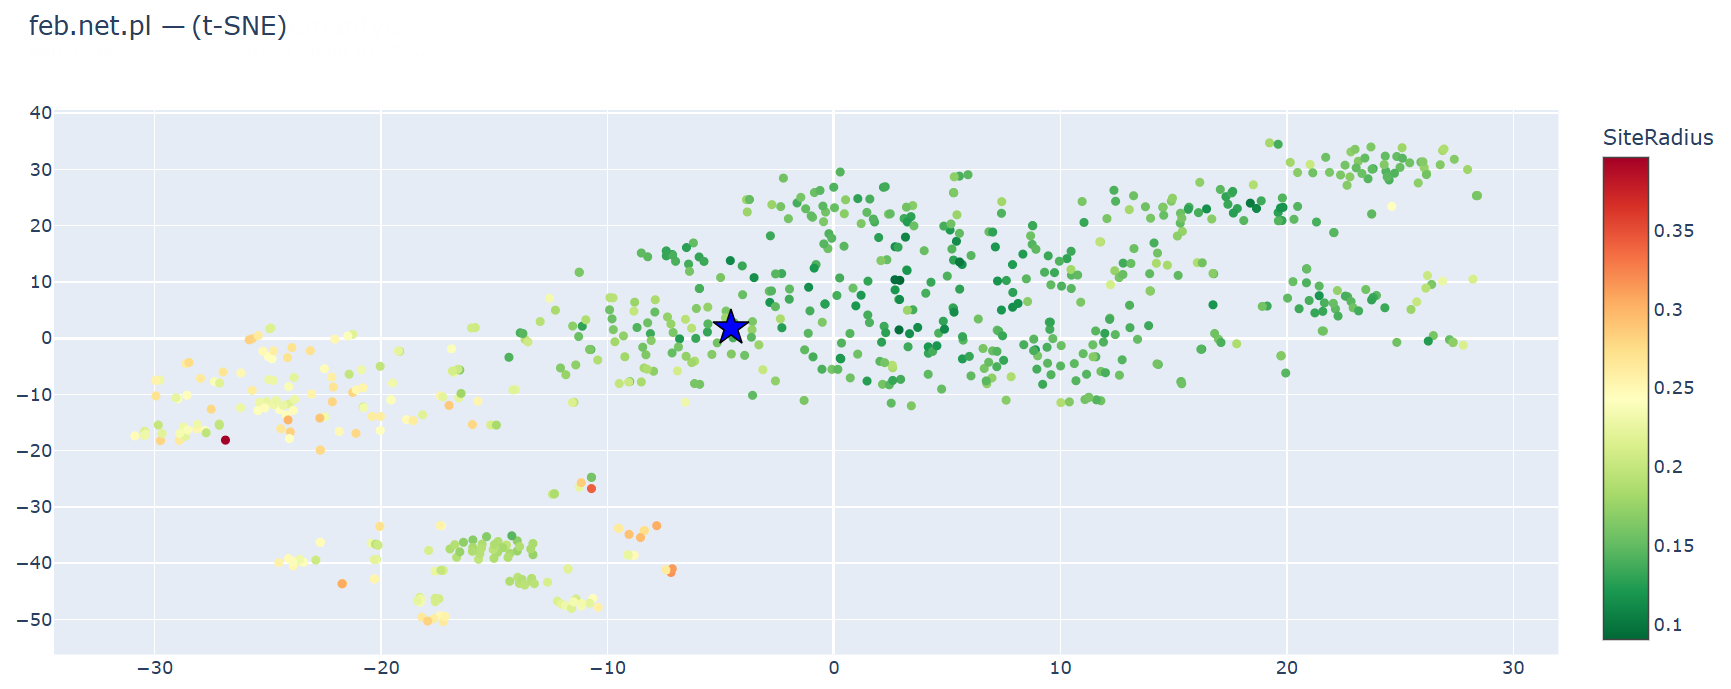
The t-SNE map reduces 3,072 dimensions to two while preserving neighbourhoods – pages with similar content land next to each other. We marked the centroid with a star. On this map you immediately spot tight, single-colour clumps of points: clusters of templated pages, more on those in a moment. The scattered red cloud at the edge of the map is our outliers.
What we found: the marketing glossary as a double-edged sword
The clearest topical pattern in the results sits in our marketing glossary – a single section whose entries range from glued-to-the-core to nearly the most distant content on the domain. Strictly marketing definitions orbit close: organic traffic, remarketing, SEM or keyword sit at 0.12–0.13, comfortably inside the domain average. Entries defining general IT, web-tech and AI vocabulary drift to the far edge. The most distant glossary entries (slugs translated from Polish in brackets where needed):
Site Radius | URL slug (glossary entry) |
|---|---|
0.2993 | transport-layer-security-tls (TLS) |
0.2913 | top-level-domain-tld (TLD) |
0.2873 | orphan-page |
0.2830 | sieci-neuronowe (neural networks) |
0.2824 | core-web-vitals |
0.2808 | whitelist |
0.2799 | churn-rate |
0.2799 | uczenie-glebokie (deep learning) |
0.2789 | gray-hat-seo |
0.2788 | above-the-fold-atf |
None of these are thin content: the TLS entry carries 1,500 characters of perfectly reasonable definition, the neural-networks entry 2,700 – they are simply not what an e-commerce marketing domain is about.
The pattern continues just below the table – mailchimp, grok-ai, claude-ai – and it is easy to name: protocols, infrastructure vocabulary and AI tooling pull away from the centroid, while the marketing half of the same glossary stays home. As a section, glossary entries average a Site Radius of 0.21 against 0.15 for regular blog posts – the price of defining every term a client might ever ask about.
The glossary is not the only thing on the periphery, but it is where the pattern is topical. The remaining far orbit – author archives, tag pages, the 404 page (the single most distant URL on the domain, at 0.3961) – is distant for a structural reason: those pages are template with a sprinkle of teasers, and their distance says more about boilerplate than about subject matter. Keeping those two kinds of periphery apart is half the skill of reading this report.
The centre of the map is a sanity check
The fifteen pages closest to the centroid read like a description of the business: four service pages (marketing – 0.0907, online sales, content marketing, lead generation), the homepage, and ten flagship blog posts about content marketing, performance marketing and e-commerce campaigns.
That is precisely what you want to see – and nothing about the method guarantees it. Blog pagination hubs – templated lists of teaser snippets that repeat the blog’s vocabulary page after page – are exactly the kind of content whose vectors could average into an imitation of the domain’s core. On our map they sit mid-field instead (0.18 on average, further out than actual blog posts at 0.15), and the centre belongs to pages that carry the site’s actual message.
The rule is worth writing down anyway: "closest to the centre" does not automatically mean "best". Centrality can be manufactured – by templated near-duplicates repeating the site's vocabulary, or by an input pipeline that quietly truncates what it embeds. When the centre of your map is occupied by structural pages rather than money pages, distrust the pipeline before congratulating the pages.
GSC verification before calling anything pruning
Not a single page was removed based on distance alone. Site Radius built the shortlist – the decision came from performance data in Google Search Console.
We checked every outlier for clicks, impressions and freshness. Only glossary entries with zero clicks and trace impressions were removed.
The TLS entry is a good example of a page that failed that check. Its Site Radius of 0.2993 puts it in the most distant quarter of the domain, and GSC showed 0 clicks and just 2080 impressions at an average position of 9.2 across three months. Distance put it on the shortlist; performance data signed it off. That entry is gone.
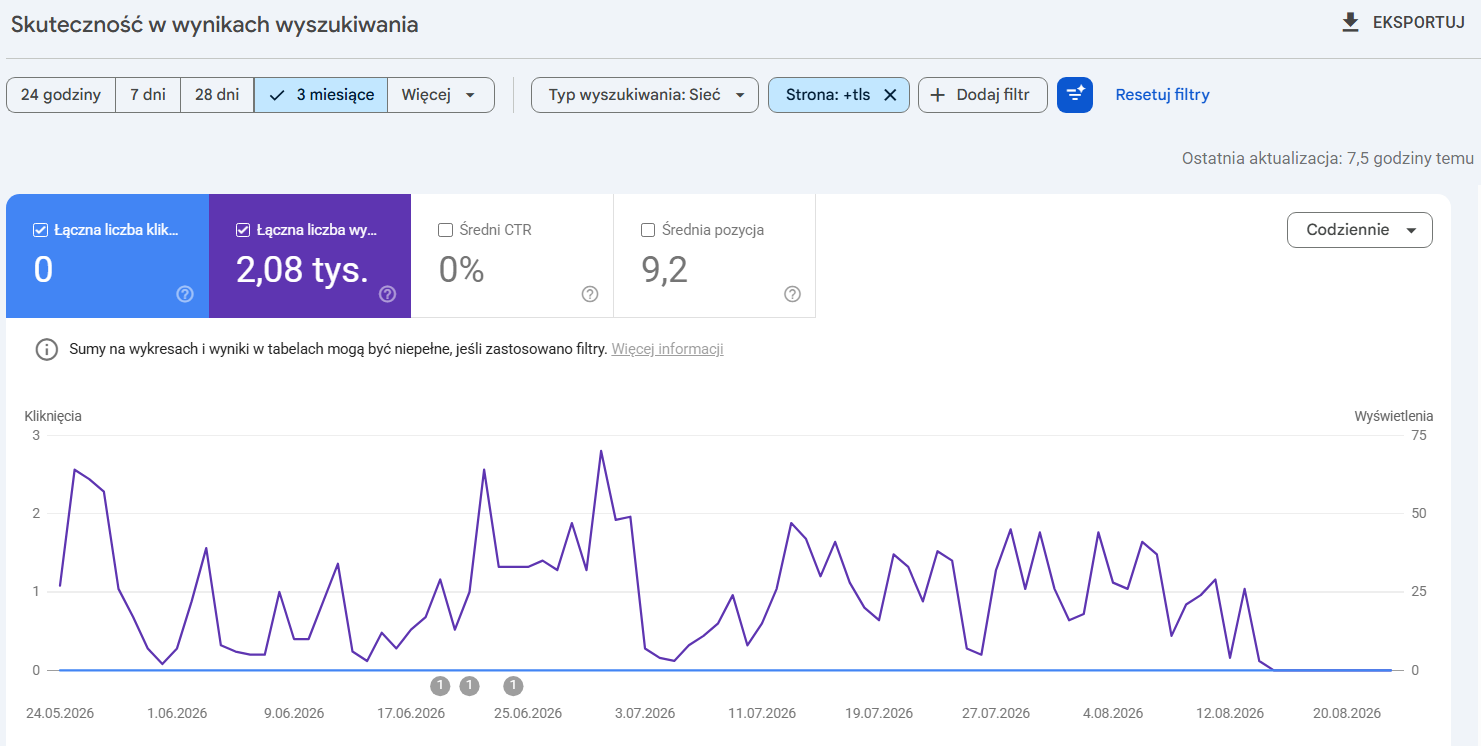
The order of operations matters, so we will repeat it plainly: distance = shortlist, performance data = decision. Reverse it and domain clean-up turns into deleting pages that shouldn’t be.
Why not just use the built-in tools?
We are not claiming a custom script beats the built-in options – it is simply a flexible route any Sitebulb user can take.
Screaming Frog ships a Low Relevance Content report, and free centroid visualisation tools exist too. Sitebulb is our only crawler, so our starting point was the crawl we already had.
What the DIY route adds is control over what happens under the hood:
- We choose the embedding model and its parameters.
- We decide what enters the centroid – which is how the deduplication step in this article came to exist at all.
- When a number looks odd, we can trace exactly how it was produced, because every step from CSV to metric is our own code.
- And we keep the raw embeddings, which enables follow-up analyses that no report offers – the pruning simulation above ran on saved vectors, for free.
One of those follow-ups is ranking candidate phrases against the centroid. We embed a list of phrases describing what the site's core could be, then check which one has the highest cosine similarity to the domain centroid – a quick Central Entity test. The code fragment below shows the whole trick: embed the phrases (one API call per phrase – remember, this model concatenates lists), multiply by the centroid, sort. We also add control phrases such as "cooking recipes" that should land at the bottom of the ranking. If a control phrase ever beats a real one, the problem is in the data, not the domain.
CANDIDATE_PHRASES = [
    "marketing agency for e-commerce",
    "e-commerce marketing",
    "online store marketing",
    "content marketing",
    # ... service pillars ...
    # controls — these SHOULD score low
    "web development",
    "logistics and warehousing",
    "cooking recipes",
]
phrase_vecs = embed_many(CANDIDATE_PHRASES, "phrases")

sims = phrase_vecs @ centroid
order = np.argsort(-sims)
for rank, i in enumerate(order, 1):
    print(f"{rank:2d}. {sims[i]:.4f}  {CANDIDATE_PHRASES[i]}")
Caveats
Structural distance is not topical distance. Author archives, tag pages, pagination and error pages orbit far from the centroid, but their embeddings describe a template with teaser snippets, not an editorial choice. Treat their Site Radius as a property of the page type: the fix is noindex or internal-linking work, not a content decision. The topical reading of Site Radius is reserved for pages with real, individual content – like the glossary entries above.
Duplicates pull the centroid. Every URL that carries the same content as another URL votes twice on what the domain is about. Our export hid 82 query-string variants and three identical-content pairs; yours will hide something else. Deduplicate first, or your "average topic" is partly an average of your CMS quirks.
Silent truncation is invisible in the output. An embedding API that receives too many tokens does not warn you – it embeds the beginning and returns a perfectly normal-looking vector. Read the model's input limit from the API, count tokens for anything suspiciously long, and log exactly which pages were trimmed. The trimming list in Step 3 is exactly that log.
Thin pages describe the template. Below 50 characters of extracted content, the vector is noise, so we exclude those URLs from the calculation – which does not mean excluding them from the audit.
And the most important caveat: this analysis complements a technical audit, it does not replace one. Site Radius knows nothing about HTTP statuses, canonicals or whether a page makes money. It only knows what the text is about. The conclusions make sense once crossed with crawl data and GSC.
How to replicate it on your own site
The whole process can be reproduced on any domain in one afternoon:
- In Sitebulb's Audit settings, configure a Content Extraction rule – the CSS selector of your main content container, extracted as Text.
- Crawl the domain.
- Download the Website Text report from Bulk Exports (URL, Title, Meta Description, Text).
- Clean the export: drop query-string duplicates, drop pages with under 50 characters of content, and at least log any identical-content groups.
- Compute the embeddings (ours: gemini-embedding-2, native 3,072 dimensions, SEMANTIC_SIMILARITY, L2 normalisation) – verifying the input token limit against the API and trimming by token count, not characters.
- Calculate the centroid and each page's Site Radius; Site Focus = 1/(1+AvgSiteRadius).
- Visualise the results (polar chart + t-SNE), review both tails of the distribution, and group Site Radius by section before judging individual pages.
- Cross-check every outlier in GSC – remove a page only when zero clicks and trace impressions confirm the distance.
One last thing: the complete pipeline from this article ships alongside it as a Google Colab notebook – including the section breakdown, the pruning simulation and the phrase-vs-centroid test. Import it, point it at your own Website Text export, and every number and chart in this piece can be reproduced on your own domain.

Marcel is an SEO Specialist at Fabryka e-biznesu (FEB), a Polish e-commerce marketing agency. He has been in the SEO industry since 2021, focusing on e-commerce, UX and conversion. His current work centres on semantic SEO – entity-based content architecture, embeddings and visibility in AI search (AI Overviews, ChatGPT, Gemini).

 Sitebulb Desktop
Find, fix and communicate technical issues with easy visuals, in-depth insights, & prioritized recommendations across 300+ SEO issues.
- Ideal for SEO professionals, consultants & marketing agencies.
 Sitebulb Cloud
Get all the capability of Sitebulb Desktop, accessible via your web browser. Crawl at scale without project, crawl credit, or machine limits.
- Perfect for collaboration, remote teams & extreme scale.