

How to Use AI to Build an SEO Progress Scorecard in Minutes
 Kaitlin McMichael
Published August 11, 2026
This week, we're grateful to Kaitlin McMichael who shows how SEO and AEO practitioners can use an agentic IDE to build shareable, data-connected scorecards and prototypes in minutes—no engineering team required!
Every single SEO professional has been asked to demonstrate the impact of their work. It’s a tale as old as time. Yet each initiative you work on might be measured using unique metrics from disparate sources. It can be time-consuming to pull in the correct metrics and demonstrate your work in a way that’s customized for your use case and stakeholders. But what if you could do data visualization by just describing what you want?
I recall trying to communicate my ideas using Balsamiq, a low fidelity wireframing tool, or using Microsoft Paint to hastily hash out arrows pointing at what I wanted to see change on a webpage. Now with an AI workflow, I can build a custom scorecard to communicate visually with my team about the progress I’m making on key initiatives.
In this article, we are going to go through the steps to build your own SEO or AEO scorecard. Once you get going, you’ll be able to do this in minutes, and impress your team with interactive dashboards, prototypes, apps that pull in data from a variety of sources and make you look like a pro - because you are.
Contents:
Communicating impact with a custom scorecard
You may hear from your manager or teammates, “What’s the impact of that thing you’re working on?” or “What’s the status of that project?” You can send them a link to your project management tool or spreadsheet, but a more concise way to answer these questions is to build a custom dashboard to show the data – and you can even have it update on a regular cadence.
You can come prepared to a meeting with a fancy dashboard that shows exactly what the impact and progress is of each of your projects, and you can set it up so that the data pulls in automatically whenever you need it to.
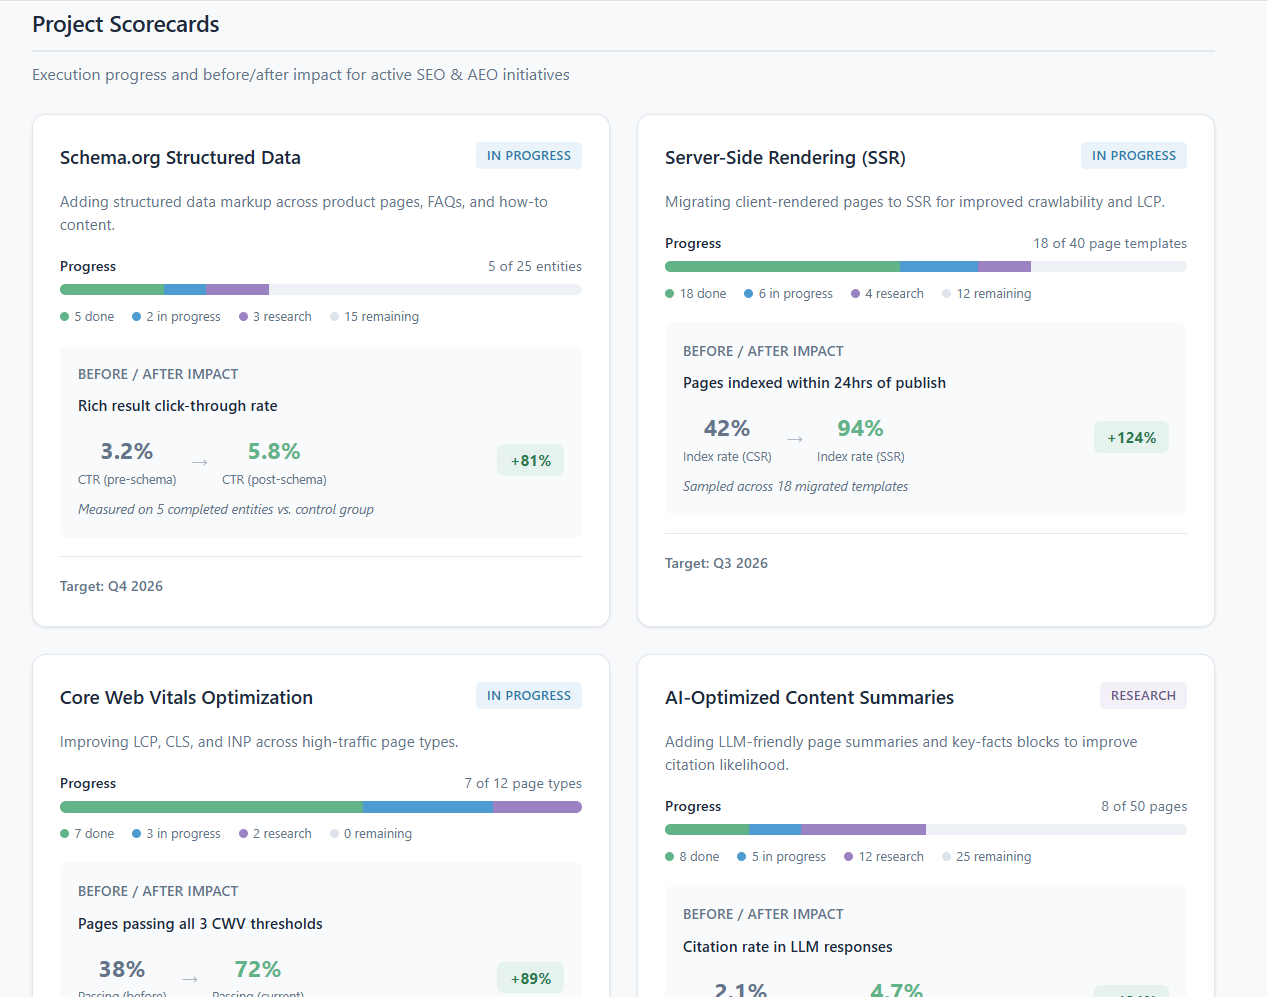
Here’s an example of what I got from one prompt in my IDE (note this is all fake data). The dashboard has some interactivity - you can play around with it here: https://generic-seo-aeo-project-scorecard.netlify.app/. This took me about 5 minutes to build.
My favorite part is the project scorecards, which show at-a-glance how your initiatives are performing based on metrics you specify, and how far along you are in the project.
Step 1: Set up
Set up an agentic IDE. What is an “agentic IDE”, you ask? Or even an “IDE”? An IDE stands for Integrated Development Environment, but don’t be afraid of that. In the age of AI, anyone, including non-engineers, can use these. An agentic IDE uses an LLM to translate natural language prompts into actions on your behalf. You can use natural language to prompt it, and it can be very powerful for getting tasks done. An IDE is much more powerful than a browser-based app, such as ChatGPT, for getting things done like with building your own prototype or app.
Some examples of agentic IDEs include:
Name | Cost | Learning curve | MCP support |
|---|---|---|---|
Claude subscription (free to $200/mo, individuals) |
|
| |
Claude subscription (free to $200/mo, individuals) |
| Connects via desktop automation, not direct MCP config | |
|
|
| |
Similar to Kiro (pricing) |
|
| |
Free to $100/mo, individuals (plans) |
| Command line needed to connect MCPs (setup docs) | |
Devin Desktop (formerly Windsurf) | Usage-quota plans with a free tier (quotas) |
|
|
For those not from an engineering background, an IDE is going to be easier to use than the CLI (command line interface). There are several listed above that you can try out for free and download to get started and see which one is easiest for you to navigate. Also consider pricing plans. When it comes to MCPs, virtually any IDE is going to support any MCP; if they have documentation on their site (either on the vendor’s or on the IDE’s) that will make it easier for you to set up and troubleshoot the MCP connection. But even if that guidance is not available, it is pretty easy to adapt the guidance from a similar example. Or even just ask your IDE for help in setting it up!
Step 2: Connect
You’ll want to use MCPs to connect your IDE to the external tools you’re interested in. For SEO and AEO, these could include third-party vendors, analytics tools, even your site’s server logs for natural language analysis.
If you’re not familiar with an MCP, it stands for Model Context Protocol. Think of it as a fairly simple, straightforward way to connect your IDE to certain information from another source. It’s like a lightweight API (Application Programming Interface). Without needing any complicated development set up, you can – within minutes – authenticate and then simply ask your IDE to grab the info you’re interested in from the relevant MCP(s). For example, you could ask “How much traffic did this page get in the last month?” If you have your site analytics set up, then your IDE will use that to retrieve the answer.
Let’s walk through how to edit MCP settings for the Sitebulb MCP. The Sitebulb MCP Guide walks you through this as well. One way to start is to ask in your IDE something like “help me set up the Sitebulb MCP.” Let’s use the Kiro IDE and Sitebulb Cloud (the instructions are different for Desktop).
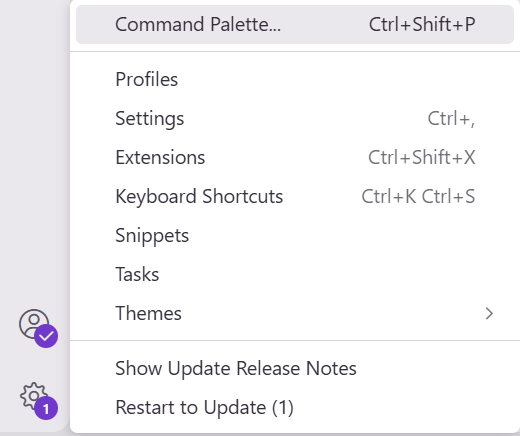
1. In the bottom left corner of your IDE, you’ll see a gear icon. Open that menu and click on Command Palette
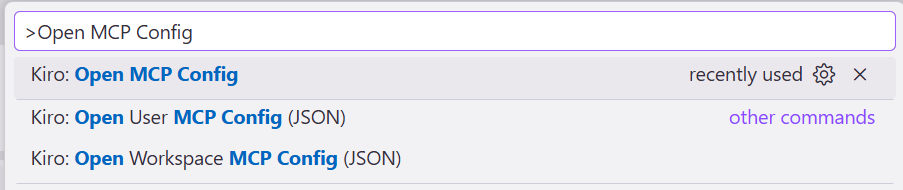
2. From there, open ~/.kiro/settings/mcp.json
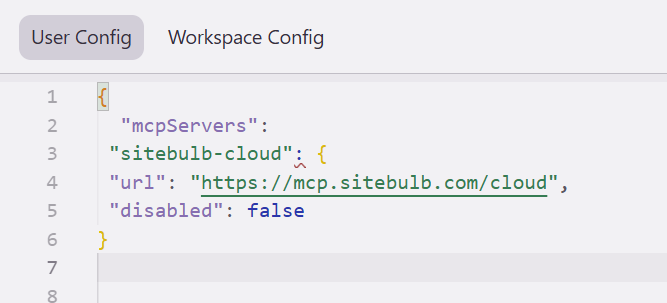
3. Inside that document (which will open up within the IDE) add this entry inside the section called mcpServers:
"sitebulb-cloud": {
    "url": "https://mcp.sitebulb.com/cloud",
    "disabled": false
}
This is how it should look:
4. Save the file
5. Your IDE will automatically detect the change, attempt to connect, and Sitebulb will handle the authentication. You’ll see a browser window open to the Sitebulb login page, where you’ll login.
6. You’ll see “sitebulb-cloud” appear in your MCP Servers panel in the sidebar.
7. You can now ask your IDE anything that might use the Sitebulb MCP, or ask it for ideas of how to use it.
Here’s some ideas for how to use it:
Quick health checks
"Summarize the latest audit for aws.amazon.com and highlight the top technical SEO risks by severity."
"How many critical and high severity issues are there? Did any get worse since the last crawl?"
"What's the overall site score, and how has it changed across the last few audits?"
Drilling into specific issues
"Find all critical indexability issues and show me 20 sample affected URLs for the top three."
"Which pages have missing H1 tags? How many are there?"
"Show me pages with duplicate title tags grouped by the duplicate value."
"List all URLs returning 5xx status codes."
Single URL inspection
"Inspect https://www.example.com/page in the latest audit. Explain its crawl status, indexability, canonicals, redirects, and associated Hints."
"What Hints are flagged against this URL?"
Comparing audits (before/after)
"Compare the latest audit with the previous one. Which high severity issues got worse?"
"What URLs are newly missing since last crawl?"
"Plot how the site score has changed over the last few crawls."
Visualizations
"Chart the issues by severity as a bar chart."
"Show the Hints for my latest audit as a pie chart by type."
"Plot the site score trend over the last 5 audits."
You can also combine data from Sitebulb with data you already have, or that you grab from other MCPs. This is where it gets really powerful and interesting. You can mash up data from Google Search Console, Bing Webmaster Tools, Screaming Frog, your web analytics, and your web server logs – and focus it all on a site section where you recently made a change. Within minutes, you can have a Word document detailing the impact of the change from multiple data points.
You could ask things like:
"Pull the top 10 critical issues from Sitebulb, then check if those pages have declining traffic in GSC over the last 28 days."
"Get pages with CWV failures from Sitebulb, cross-reference with seoClarity to see their ranking keywords."
You may also want to build a skill or steering document to help your IDE quickly reference how to connect to things it might not remember how to do right away, especially if these don’t have direct MCP access. What this will do is keep a short document that tells your IDE how to access what you’re looking for. So if you say, for example, “Tell me how many LLM live retrieval user agents requested this page last week”, the IDE will reference the relevant steering document to help it find where to retrieve that information, if you don’t have an MCP that will help with that.
Step 3: Start Prompting
You can be as specific (sometimes called “spec-driven”) or vague (“vibe-driven”) with your prompts as you would like. When you are more spec (short for “specification”)-driven, you will often start with relevant documents or other sources, such as screenshots or urls, that help your IDE form a very clear understanding of exactly what it is that you are looking for. When you are more vibe-driven, you are exploring along with the IDE through a conversation about what it is that you are looking for. There are pros and cons to each approach. The pros of spec-driven coding are that you will be more efficient, whereas with vibe coding you may explore options you didn’t think of.
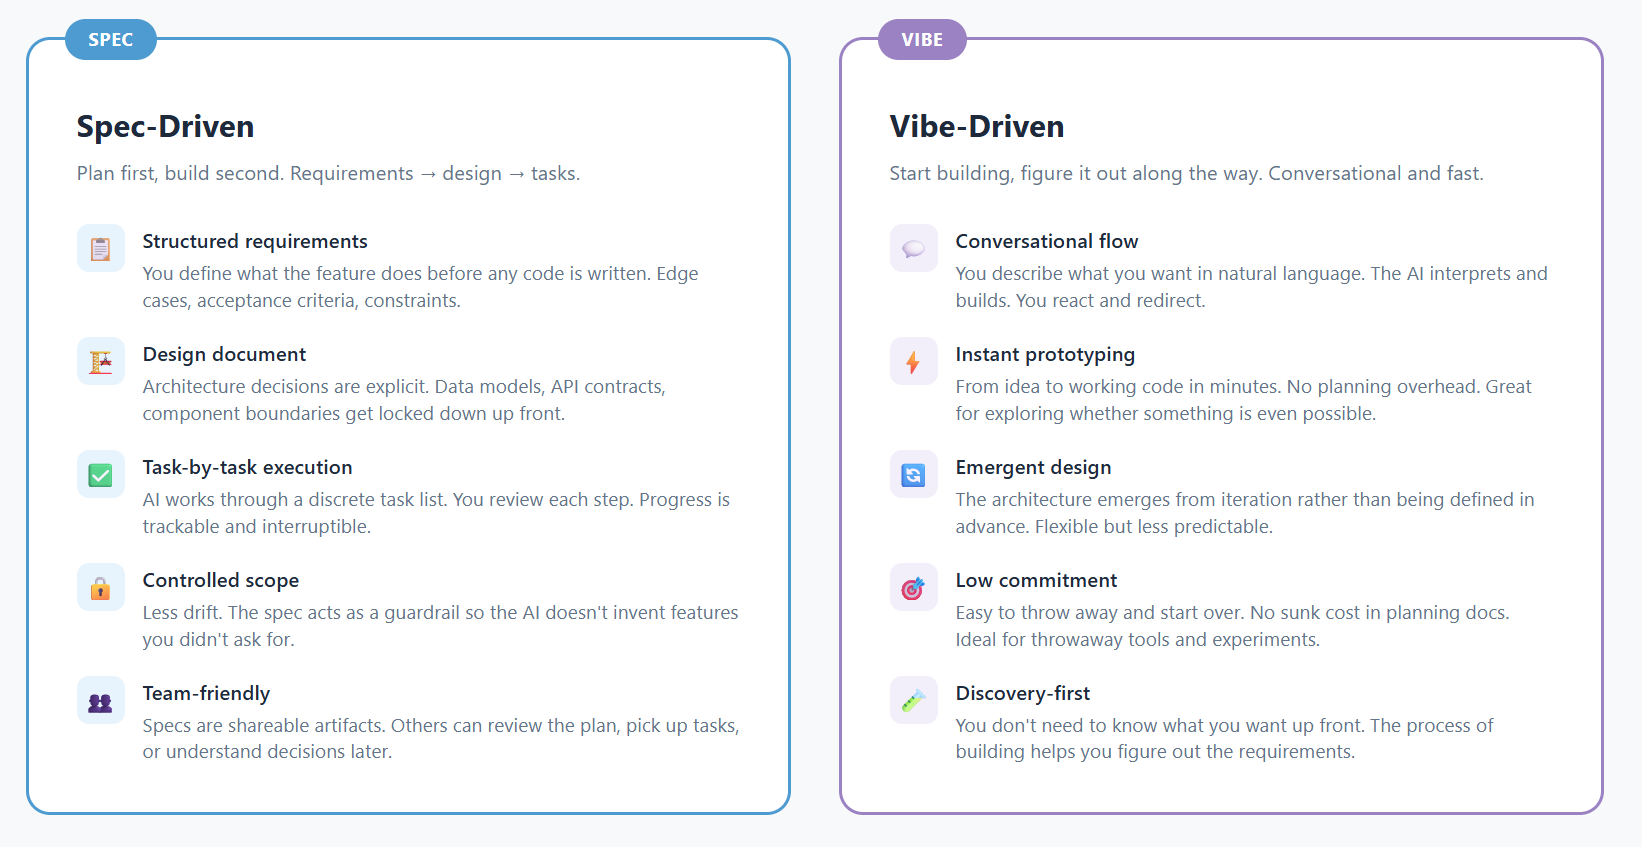
Here’s an example of how you might be more vibe-driven:
“Help me build a custom dashboard to show to my boss and team”
[agent builds a first draft; you hate it]
“Make it use this color scheme (supply color scheme from Figma or similar)”
[agent swaps out colors]
You say: “I like this part, but this other part doesn’t make sense. Can you make it so the funnel actually show the topline metrics at top layer and so forth?”
[agent fixes the funnel to actually look like a funnel
You say: “I like the funnel but the lines in the line chart are too hard to see. Can you make the font sizes larger and the colors darker?”
[agent makes the line chart more accessible]
…. And so on, where you have a chat with the agent and refine it until you like what you see
Here’s an example of how to be more spec-driven:
Draft a document with inputs from multiple stakeholders about what they’d like to see in the dashboard. Upload this along with the following materials.
Upload 1+ screenshots that show exactly what kind of dashboard you are looking for
Upload a document or explain in your prompt exactly what you want to be different from what’s in the screenshots
Your prompt might start off like this: “Build a dashboard that looks like this Google Studio Dashboard, but has a line chart showing brand, non-brand, and combined clicks YoY, MoM, and WoW. Make the dashboard interactive so that a user can swap out the metrics for impressions, CTR, and average position.”
From there, you may continue the conversation, and the agent may ask you for direction.
While I am a product manager, and like the ability to be spec-driven with agentic IDEs, vibe coding has been helpful for quick, iterative approaches. I will generally give the agent as much as I can upfront, because the more specifications you can give as the inputs, the better and more efficient the outputs. Efficiency is important if you have a token budget. Either way, you can have a conversation with the agent, and not be afraid to adjust and tweak your app/prototype/design over time.
Here’s an example of a spec prompt that you can use to build a custom scorecard:
Build a single-page HTML/CSS/JS scorecard (no frameworks, Chart.js via CDN) with dummy data. Structure:
1. KPI CARDS (MoM + YoY % change each):
SEO-influenced visits, sign-ups, sales
LLM referral visits, AI retrieval bot visits, citations, mentions
2. LINE CHARTS (6-month YoY, solid=current year, dashed=prior):
One chart for SEO metrics
One chart for AEO metrics
3. FUNNEL (widest at top, narrowing by position):
Band 1: Bot retrieval visits + citations + mentions
Band 2: LLM referral visits + SEO visits
Band 3: Sign-ups
Band 4: Revenue
Each band shows sublabel breakdown. Values must decrease top to bottom.
4. PROJECT SCORECARDS (5 cards + "Add New" form):
Each card: name, description, segmented progress bar (done/in-progress/research/remaining), before/after impact with % lift, target date.
Projects: Schema.org markup, SSR migration, Core Web Vitals, AI content summaries, internal linking.
"Add New" card: metric type dropdown (8 options + custom), measurement guidance text per selection, form fields for progress + impact, submits client-side.
Files: index.html, styles.css, data.js, app.js. Responsive. Clean card-based layout.
Step 4: Preview in the Browser
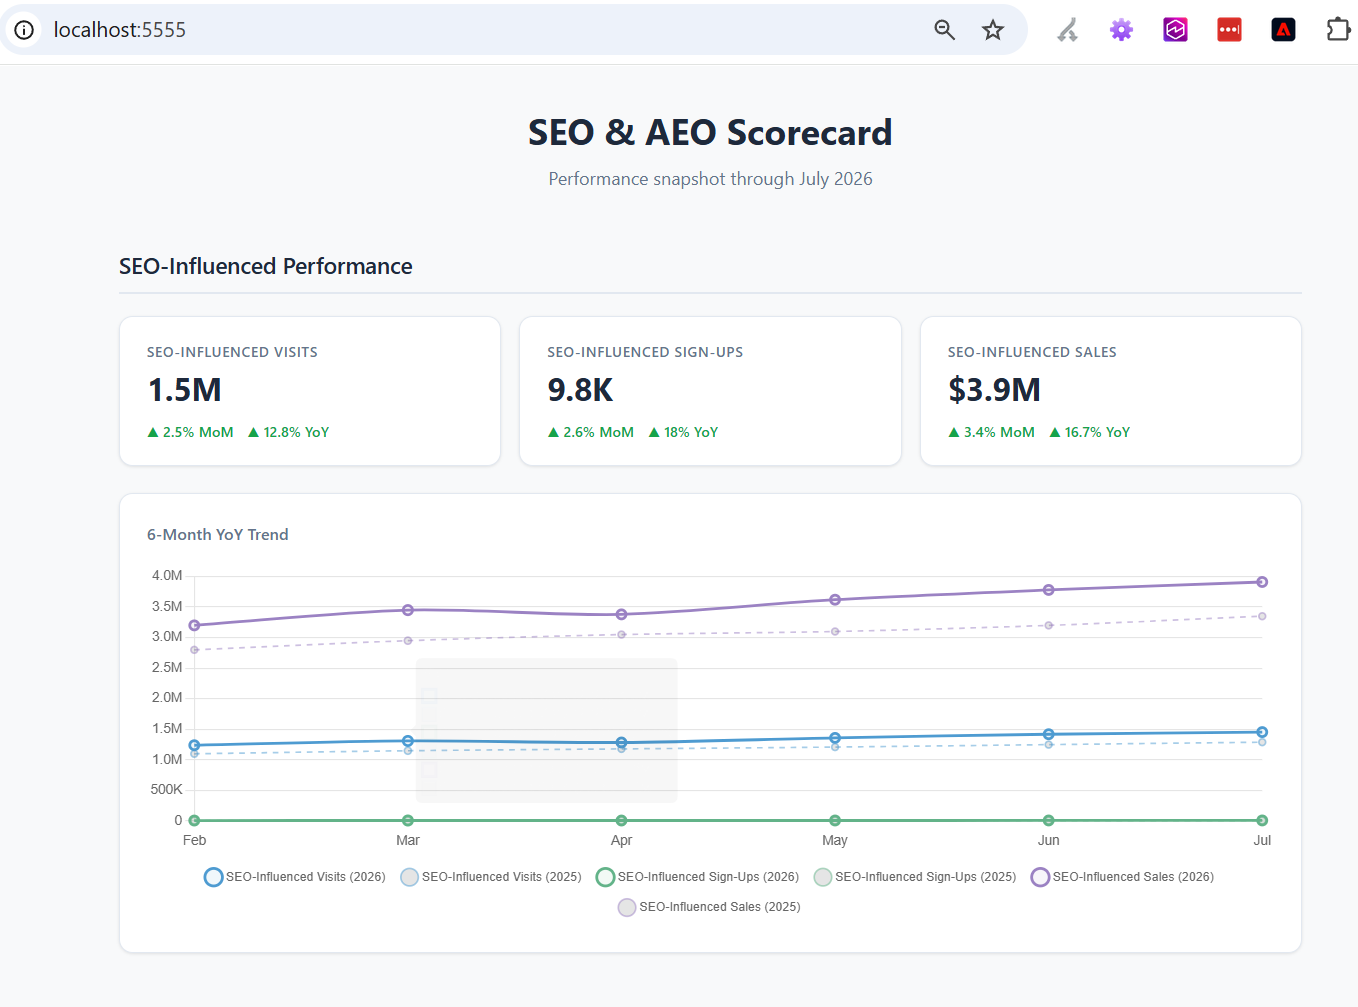
You can ask your IDE to show you a preview of what it’ll look like in your browser. This make it easy to see exactly what you like or don’t like about what it produced. Maybe the formatting turned out weird in some cases or you don’t like the interactive transition it chose; so you can prompt it to make those updates. For example, you could tell your IDE: “Make the borders of each chart rounded and have a darker border color, and make the font size larger for the chart titles.”
Here’s an example of the custom dashboard in my local browser:
Step 5: Upload to a Sharing Site
Next you’ll want to share your stuff with others. For an interactive app/prototype, you need a tool like Netlify. There are other options but we’ll focus on Netlify for this example. After setting up an account with one of these sites, you’ll upload your HTML file(s) into these. You’ll set up your permissions and then you’ll be ready to share.
Let’s use Netlify for this example.
Drag and drop your files to this browser window
It will give you a shareable url
Share with your co-workers
If you need to change anything, upload again to Netlify and your co-workers can refresh the page to see the changes
Here’s the shareable dashboard I created which you can view & interact with: https://generic-seo-aeo-project-scorecard.netlify.app/
Now you can paste that URL into a Slack message and impress your boss, team, client, and fuzzy cat.
You can also set up a weekly/monthly refresh cycle to have your scorecard be updated on a regular cadence.
You can even use what you create to get user feedback quickly. For example, take a prototype of a new customer experience, like a widget or new feature, and share it on usertesting.com to get feedback.
Limitations & Troubleshooting
When you’re relying upon AI workflows, please realize the limitations of running data through an LLM. There will likely be “data drift”, in which the LLM summarizes, rounds numbers, estimates, or otherwise makes errors. If you’re putting this info in front of clients or leadership, you should check every number. You can also build in guardrails during the spec phase, by asking your IDE to follow certain guidelines - such as brand guidelines, design standards, or legal compliance.
For communicating project updates, this kind of tool can be useful. But for making revenue and prioritization decisions, you need to stand behind every single number. So take the time to validate that each number in your scorecard is correct, before you put an AI-generated scorecard in front of the C-suite.
If you need to conform to design standards, but you don’t have the actual specs (i.e. a design library spec or files), then your IDE will struggle. It’s often not enough to say, “Make it look like this.” You need to say, “16pt font with padding, left-aligned…” etc.
If you skip any of the steps outlined above, such as not previewing the output and reviewing everything, you risk showing off incorrect or incomplete data. The agentic IDE is not meant to completely remove the heavy-lifting; it does about 80% of it, but it still needs human review.
If you get stuck, the IDE is remarkably helpful at helping you troubleshoot. For example, if an MCP connection stops working, ask your IDE why. You may need to open the terminal and copy and paste the logs, but the IDE can show you how to do that each step of the way.
Other ways to extend this AI workflow
Once you’ve gone through the process of using an agentic IDE to build a scorecard, you’ll start to imagine possibilities for other lightweight apps or prototypes. It’s addicting. Here’s some other ideas for use cases leveraging this type of workflow:
Build a wireframe that shows ideal relationships / information architecture
Build a live analytics dashboard or other data visualization tool
Build an internal workflow tool, such as a RICE scoring model customized to your company (I’ve done this at my company)
Build an alternative experience for your website or mobile app
Build an A/B test mockup to show different versions of a page or page component
Instead of waiting for engineering, product, and/or design to collaborate on your idea, you can take the first step with your idea with an agentic IDE.

Sitebulb is a proud partner of Women in Tech SEO! This author is part of the WTS community. Discover all our Women in Tech SEO articles.

Kaitlin is a Sr. Technical Product Manager, at Amazon Web Services, focusing on AEO. She has been in the SEO industry since 2010, when she started as a writer at a travel agency in Lima, Peru. She has spoken at Women in Tech SEO Portland 2026; TravelCon Boston about SEO; internally at AWS & Getty Images and has given webinars at Moz & Portent. She’s written for Women in Tech SEO, Moz, and SEMRush. All opinions are the author’s.

Related Articles
 How To Automate Content Brief Creation For B2B With Claude

 Webinar: The SEO Stack Has a New Layer, and It's Called MCP

 Building AI Skills for SEO: Where to Keep a Human in the Loop
 Sitebulb Desktop
Find, fix and communicate technical issues with easy visuals, in-depth insights, & prioritized recommendations across 300+ SEO issues.
- Ideal for SEO professionals, consultants & marketing agencies.
 Sitebulb Cloud
Get all the capability of Sitebulb Desktop, accessible via your web browser. Crawl at scale without project, crawl credit, or machine limits.
- Perfect for collaboration, remote teams & extreme scale.