If you have been experiencing issues when trying to crawl websites using the Chrome Crawler, please follow the steps below to diagnose and (hopefully) fix the problem.
An astonishing amount of software related issues can be resolved simply by restarting your computer - it is almost always the first thing to try when trying to fix issues.
And yes, we know it's annoying to have to shut all your programs down and interrupt your work, but it's the most straightforward of these resolution steps, so please make sure you do it.
If you're still experiencing issues after restarting, please follow the advice below.
There are quite a lot of different error messages you can see relating to our Chrome Crawler, most of which are pretty similar.
This one however is different: it occurs on the 'New Project' screen and it looks like this:
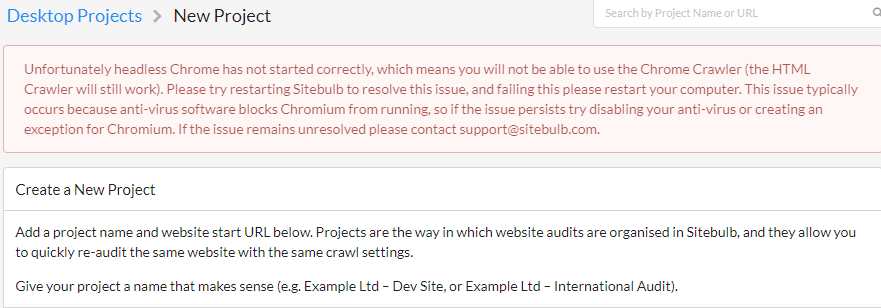
If you see this error, you should be able to fix the problem simply be reinstalling the software (please download from here).
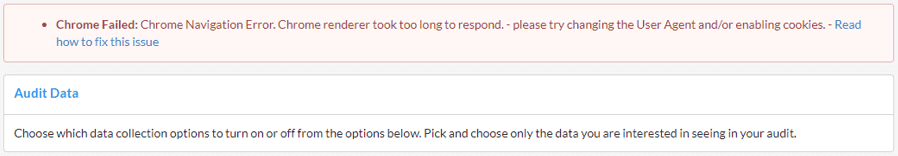
The other most common errors you will either see on the audit setup screen, or in the audit overview after it has attempted/failed to complete the audit:
If you see these messages, it is most likely a crawl configuration issue or an issue with the website itself (although it could also be an internet issue, a proxy issue or a firewall issue...!).
Keep following the steps below to help diagnose and fix these problems.
Please see the list at the bottom of this page for all possible Chrome Crawler error messages.
You may have a problem with the Chrome Crawler in general, or it may just be a problem with the one site you are trying.
You can confirm by trying the Single Page Analysis tool with https://sitebulb.com - which should come back with information as normal. Just use the default settings, don't adjust anything.
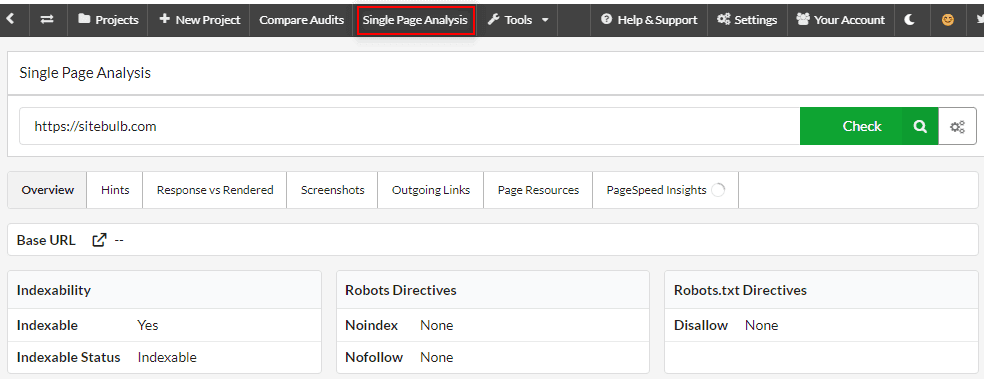
If it does come back with data (like the image above), this means the Chrome Crawler is working in general, but there is a site specific issue that you may be able to resolve by adjusting the configuration.
If you get a failure at this stage - where the Single Page Analysis does not work for the Sitebulb website, skip to Step 8, otherwise continue:
Now try the start URL for the problem website you were initially trying to crawl.
You should also see a failure message:
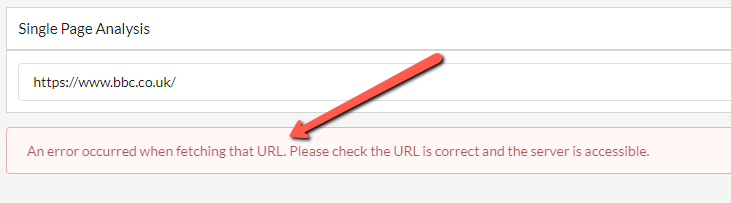
An error at this stage is expected, since we already know that Sitebulb is having problems trying to crawl the website.
At this point, it is worth ruling out connection issues before we move on to troubleshooting audit settings.
Sitebulb needs a consistent connection to an IP address to perform various checks during the setup and auditing process. If this connection unexpectedly changes or is interrupted, you are likely to see errors.
If you are accessing the internet through a VPN or Proxy, turn it off and try running the audit on your local machine.
From the Single Page Analysis screen, click the little cog on the right hand side to open up the Advanced Settings. This is quite a long pane so there is a scroll bar on the right which you will need to scroll to access some of the configuration options.
You will need to try different options, and different combinations of options. Once you have changed one of the configuration options, press the green Check button at the top to test it again.
The first things to try should be:
If it does start working, you should have found your solution. So let's say that the User Agent needed changing to 'iPhone', you would the need to go back into your project settings and update the User Agent there.
Assuming it is still not working, open up the Advanced Settings again, and this time scroll down a little, so you can also test:
Again, you will need to try different options, and different combinations of options. Once you have changed one of the configuration options, press the green Check button at the top test it again.
Hopefully by this stage you should have established which options need to be toggled on/off in order for the Single Page Analysis to return results as expected.
Once you have worked out which settings need to be tweaked, you'll need to go and set up a new project in Sitebulb with your amended settings - using the start URL of the problem website.
Note: We would always suggest starting a new project rather than just adjusting an existing project.
Depending on which setting(s) you needed to change in order to get the Single Page Analysis tool to work, you may need to adjust settings in a couple of different places.
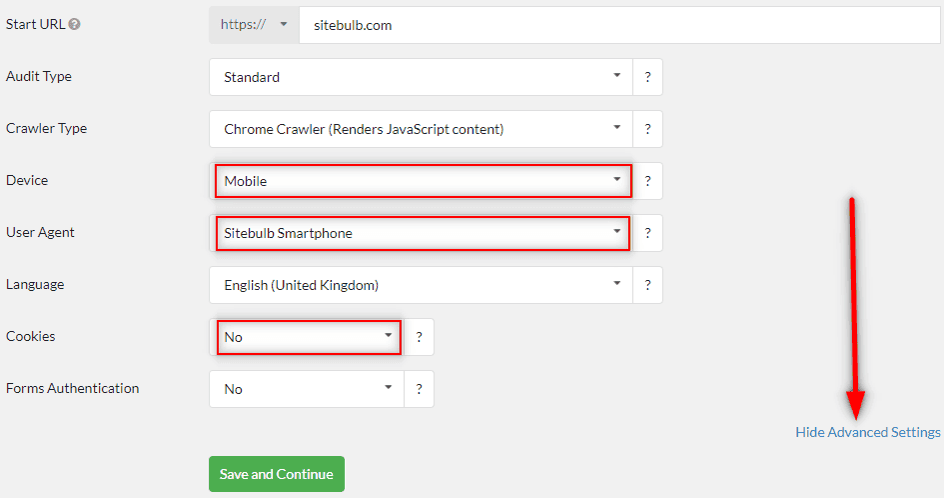
The 'New Project' screen allows you to adjust the Device, User Agent and Cookies (Yes/No) - but to see these options you need to hit Advanced Settings in the bottom right:
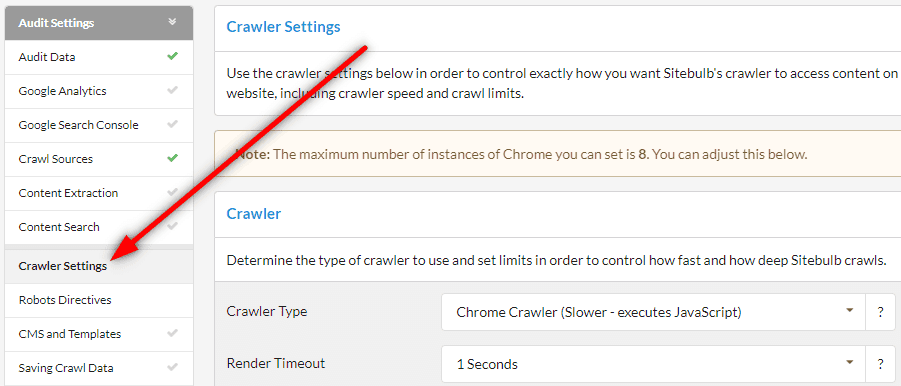
The remaining Chrome settings are available once Sitebulb has performed the pre-audit checks (which happens after you hit Save and Continue on the New Project page).
You first need to navigate to the Crawler Settings, from the left hand menu:
Then scroll down to find the Advanced Chrome Crawler Settings, which include all the toggles for Flatten Shadow DOM, Flatten Iframes, Incognito and Enable Service Workers.
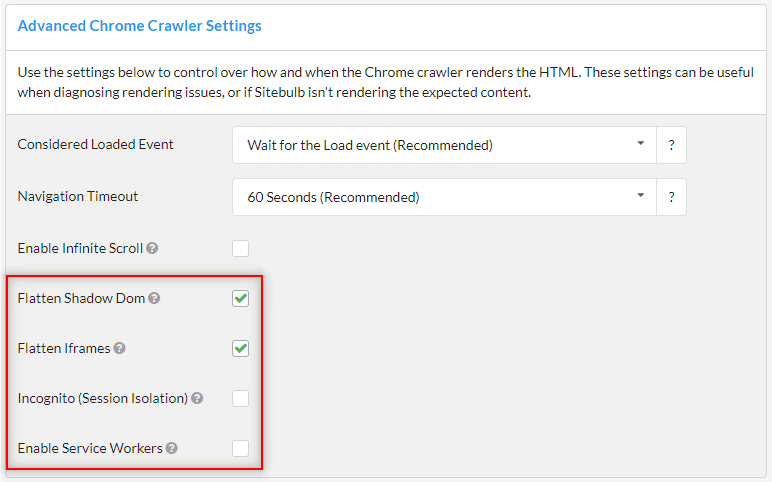
Again, you want to replicate the settings that worked for you on the Single Page Analysis tool.
Then, go ahead and see if Sitebulb will crawl the site (fingers crossed!).
If you've tried everything listed above, but Sitebulb STILL will not crawl properly, it is probably something we have never seen before. In which case we'll need to work with you to get to the bottom of the issue (which we will!).
Please email [email protected] and provide the following information:
We'll look into it and figure out what we need to do to make it work!
You should only have come here from Step 3, which means that the Single Page Analysis is not working for the Sitebulb website.
Without meaning to worry you, this essentially means that there is a broader problem with the Chrome Crawler on your machine (e.g. anti-virus is blocking it).
It is important at this stage that you realise that what we refer to as our 'Chrome Crawler' utilizes a version of headless Chromium, which is basically a developer-friendly open source version of the Chrome browser we all use every day. It is important because once you get into the weeds of it, you will see references to 'Chromium'.
Anti-virus software can be both aggressive and inconsistent, particularly when it comes to something like headless Chromium, which certainly CAN be used in malware or adware (even though Sitebulb absolutely does not do anything dodgy).
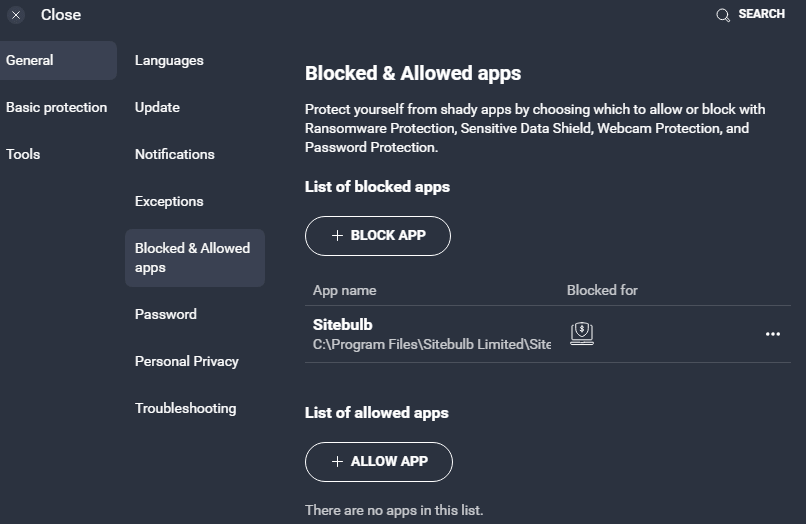
In order to check this you will need to go into your anti-virus settings and find 'Blocked Apps' (or similar), like this in AVG:
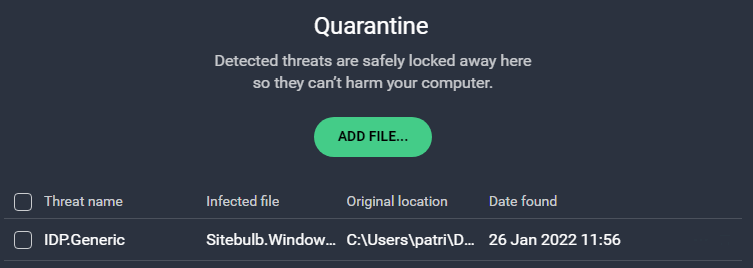
Or you might find it in quarantine:
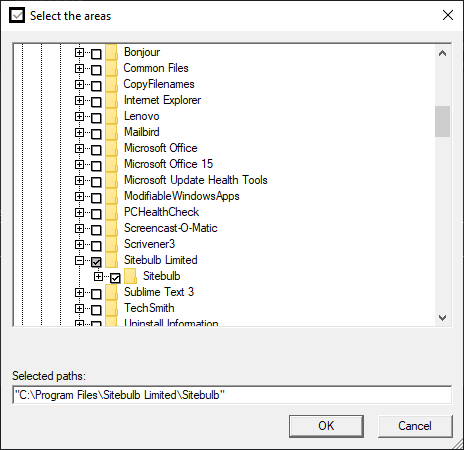
If it is, then remove any blocks, and add the entire Sitebulb folder as an exception:
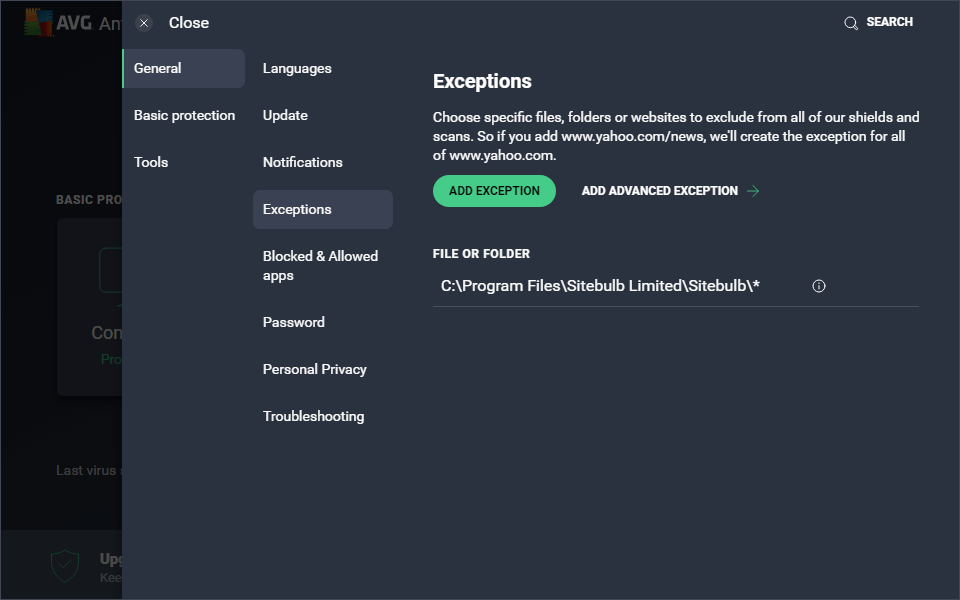
This should then look something like this:
This should stop Sitebulb from being targeted by the anti-virus software in future. HOWEVER, in our experience, one of the most common things that anti-virus software does is actually delete the installed Chromium .exe file out of the Sitebulb folder.
So before you proceed, reinstall the latest version of Sitebulb. And do not worry, you will not lose any of your old audits or anything - this is just like applying an update.
Once you have reinstalled Sitebulb, open it up and head back to the Single Page Analysis tool and try again.
If it works...huzzah! You've fixed it. Now you should be able to go back and run your audit again.
If it doesn't work, move onto step 9:
Similar to anti-virus, your firewall could be blocking Sitebulb from making outgoing connections (which it needs, in order to crawl websites).
Check that Sitebulb is in your 'allowed' list:
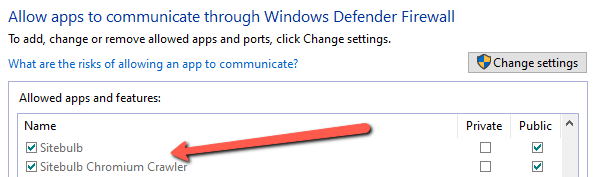
If not, add it as an allowed app. Also check that port 10401 and 10402 are allowed - as Sitebulb needs these ports to communicate.
Once you have adjusted your firewall settings, open it Sitebulb and head back to the Single Page Analysis tool and try again.
If it works...huzzah! You've fixed it. Now you should be able to go back and run your audit again.
If it doesn't work, move onto step 10:
If you've tried everything listed above, but Sitebulb STILL will not crawl properly, it is probably something we have never seen before. In which we'll need to work with you to get to the bottom of the issue (which we will!).
Please email [email protected] and provide the following information:
We'll look into it and figure out what we need to do to make it work!
For reference, these are all of the error messages you may see related to the Chrome Crawler:
The last one will look something like this: