By utilising Sitebulb's integration with Google Sheets, you can build fully automated Looker Studio reports and dashboards.
You can instruct Sitebulb to automatically push a 'historical audit overview' up into Google Sheets, which can then be used as a data source in Looker Studio.
The whole thing is designed to work with scheduled audits (i.e. daily/weekly/monthly) as Looker Studio is particularly good at showing 'change over time.'
This guide will step you through the entire process, so you can then start building out your own reports.
If you prefer to skip instructions and just figure it out on your own, you can find our Looker Studio Audit Template here.
The Looker Studio integration is made possible by a specific Sitebulb export that needs to be uploaded to Google Sheets. The sheet is called 'Historical Audit Data', and it contains top-level metrics, one row for each audit within the project.
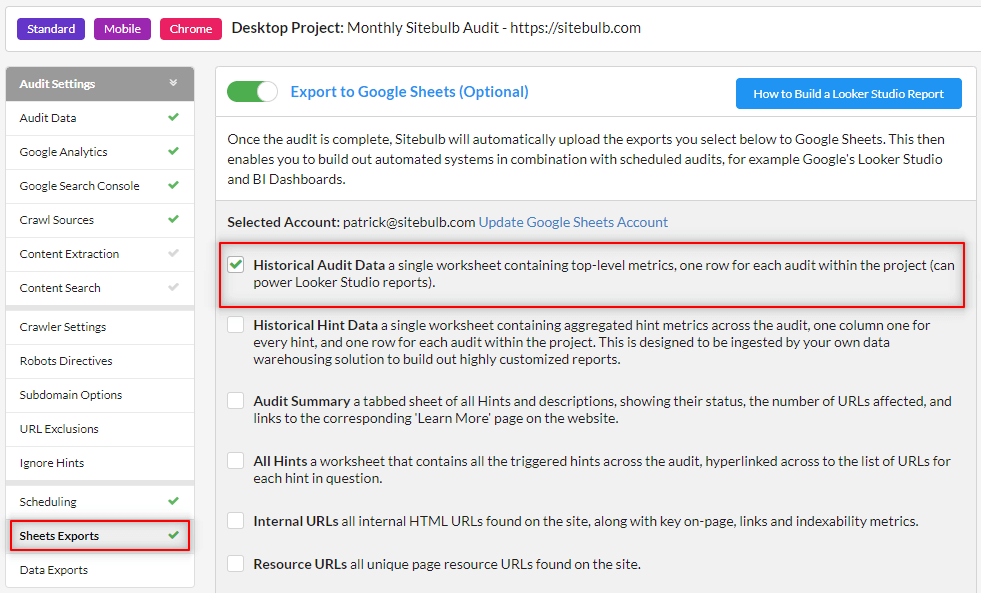
You can set up your project to automatically generate this export at the end of each audit and push it up into Google Sheets, by using the 'Sheets Exports' option on the left hand side of the audit setup screen.
By default all of the boxes will get ticked once you authenticate your account, but the only important one for Looker Studio is the top option.
You can also edit the settings of an existing project in order to add the Sheets Exports option. Once this is done, when the next scheduled audit runs, your data will export to Google Sheets and back-date the previous audits.
If you already have existing audit data that you wish to use - for example a monthly audit that you've been running for the last year - you can make Sitebulb generate the spreadsheet without waiting for the next audit to run.
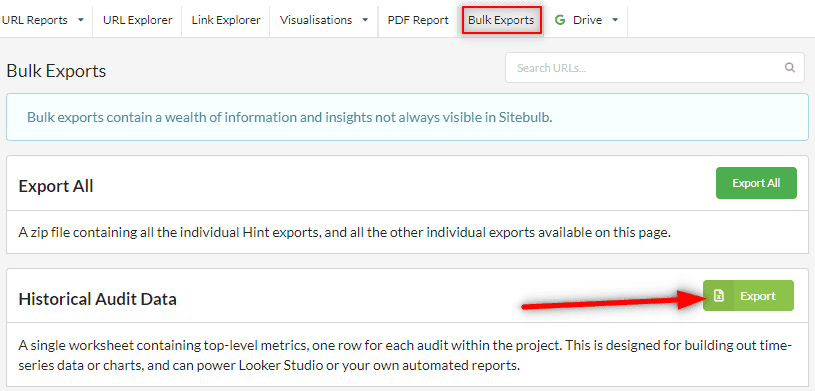
To do this, navigate to your latest audit, then choose the Bulk Exports option from the top navigation, and export the Historical Audit Data directly from there.
Whether you use the auto-export to Sheets option, or the manual 'bulk export' method, the result is the same - you will end up with a new Google Sheet that contains all the historical audit data.
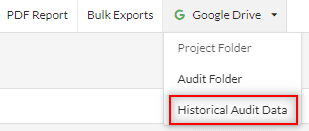
You can navigate there directly from your Sitebulb audit by using the Google Drive dropdown in the top navigation.
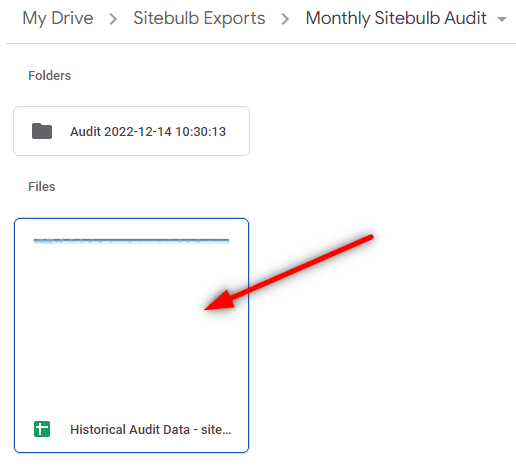
When you open the sheet up you should see all your audits in chronological order, with the most recent at the bottom. There are 271 columns of data, each relating to a different metric from the audit. This is every metric that Sitebulb can (currently) provide - you don't need to select the data to include, it will all just be there by default, with 0s in columns where no data is present.
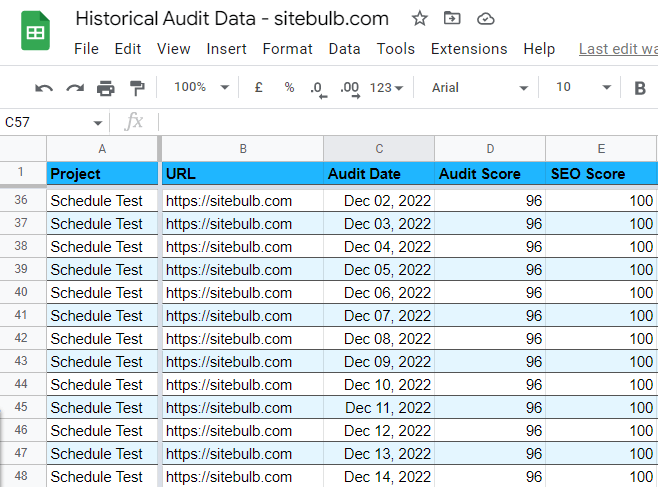
Note: This sheet inherits the global styles you set for Google Sheets formatting - which is why mine looks a bit weird!
As long as you have the 'Sheets Exports' option set up in the audit (see above), whenever future audits run within this project, Sitebulb will append a new row to the bottom of the Google Sheet, with the latest audit data.
Whatever you do, DON'T edit the sheet. Don't delete columns you don't think you need and don't rename the columns in the sheet - instead, in Looker Studio you will just select the bits you want to keep. The spreadsheet must maintain the same starting set of columns, otherwise appending columns will not work properly.
Once the Historical Audit Data sheet exists, it can be used as a data source within Looker Studio. You can use this to build out your own reports from scratch, or you can make use of the Sitebulb Looker Studio template as a starting point.
Sitebulb's Looker Studio Template
To get started, head over to our Looker Studio Audit Template Here.
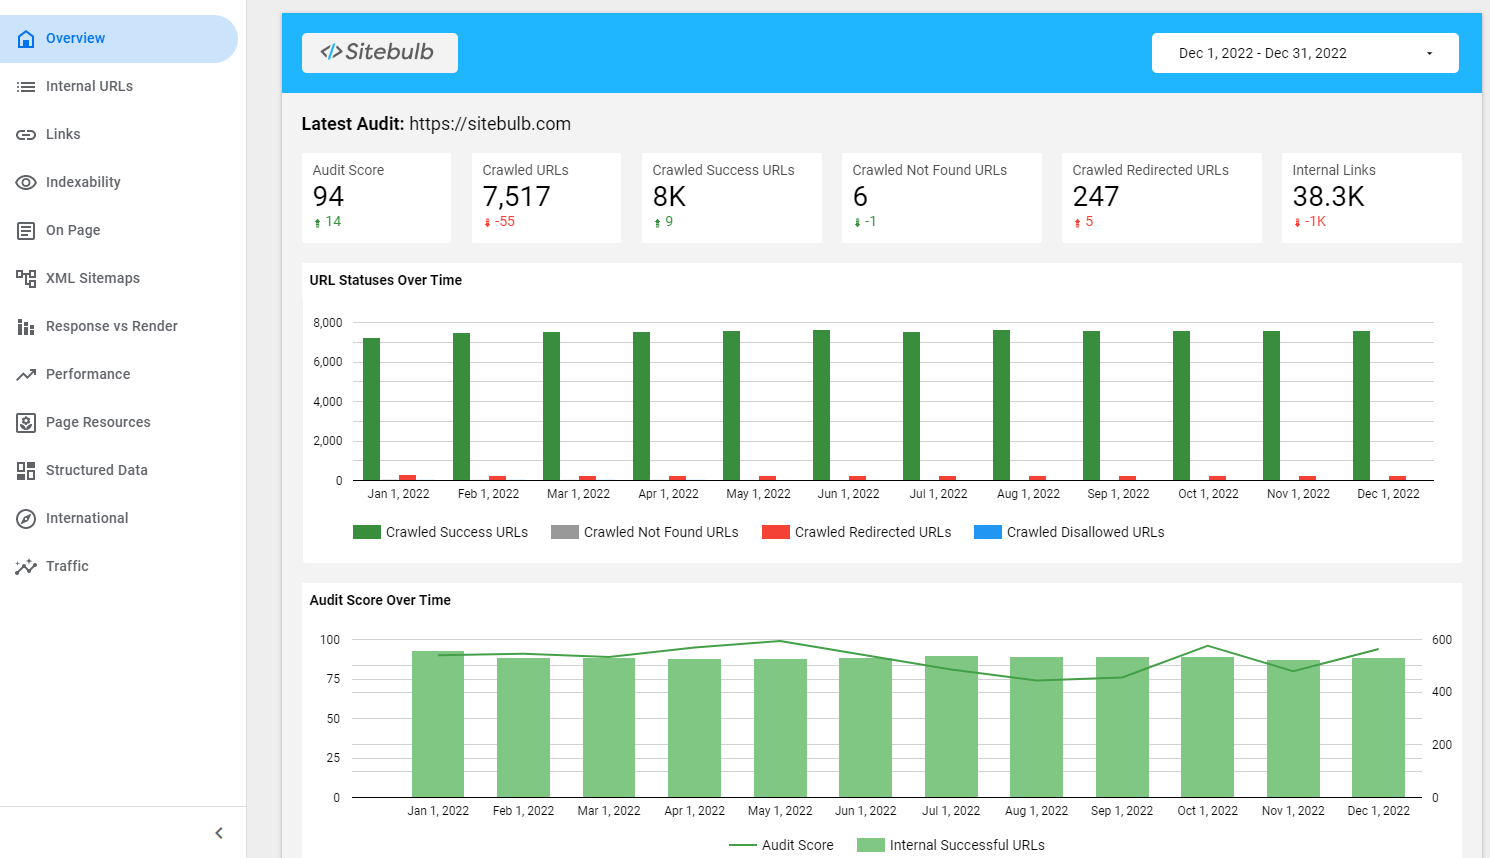
Explore the different reports down the left hand side, which will give you a flavour for the types of data that you can pull through, and what sort of thing you can do with it.
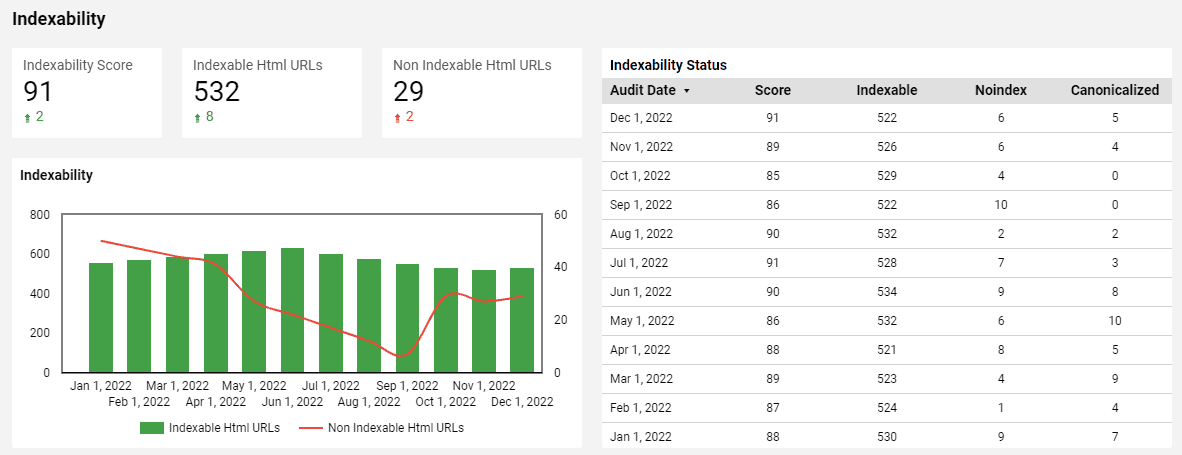
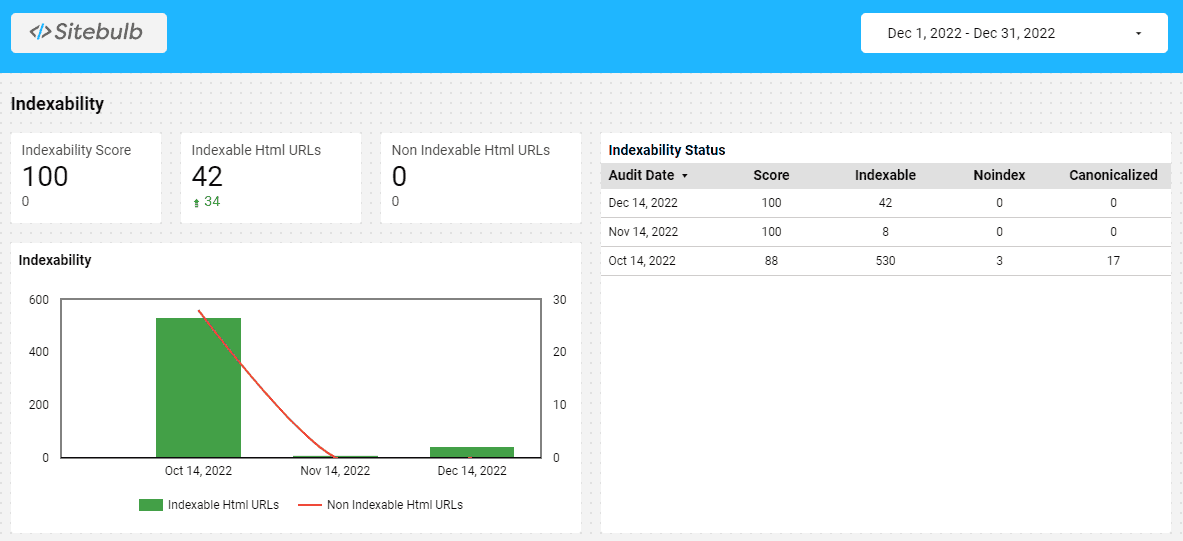
For example the Indexability report will show you indexable vs non-indexable data, as well as the different indexable states.
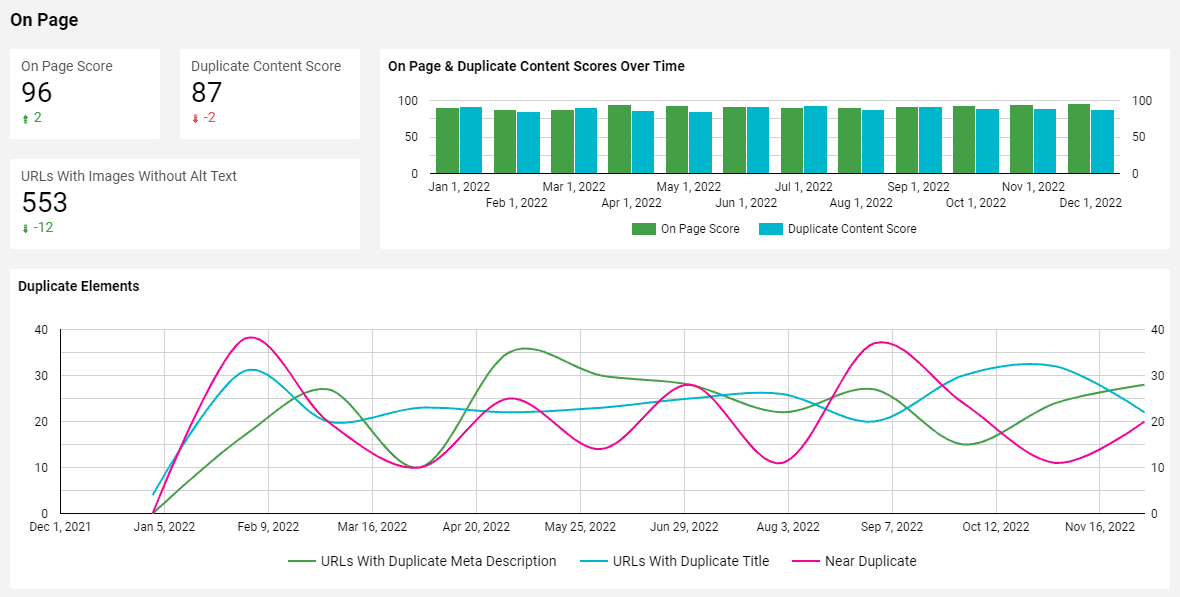
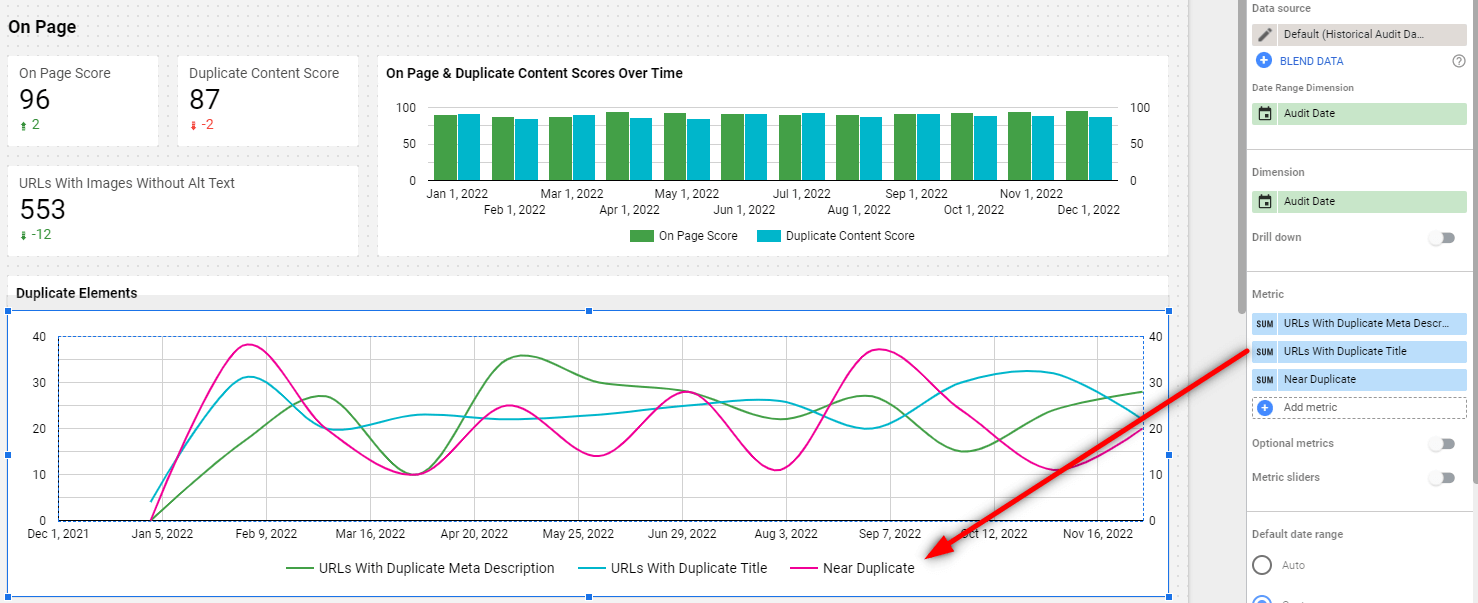
The On Page report will show you content elements and duplicate content data on the same page.
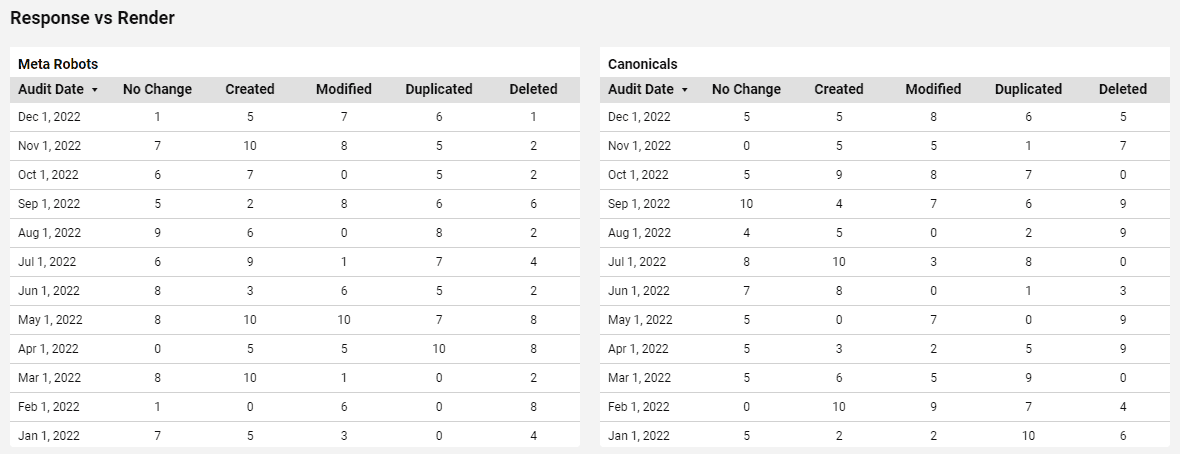
And Sitebulb's unique Response vs Render report is also reflected in Looker, so you can easily see how rendering has affected different page elements over time.
The different reports are pretty self-explanatory, and the point is not really that you just copy what we have built - but instead use the template as a starting point to build out your own customised reports with exactly the data that you want to see. And of course, blending Sitebulb data with other data sources, so you can have audit data alongside keyword, rankings or backlink data.
Copying the template
To get started, head over to our Looker Studio Audit Template Here.
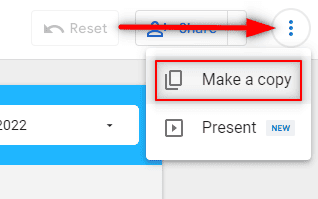
From the burger menu in the top right, select the Make a copy option:
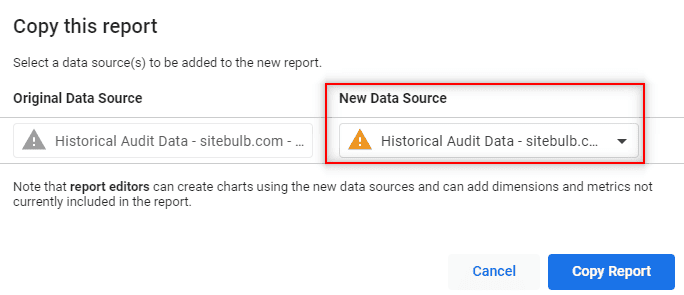
Now a modal will pop up in the middle of the screen asking you to select a data source. The original data source which is currently powering the template will not be accessible to you (unless you happen to work for Sitebulb) so you will need to tell Looker Studio which data source to use instead.
To do this, click the dropdown option under 'New Data Source' and scroll down to the bottom so you can select Create data source.
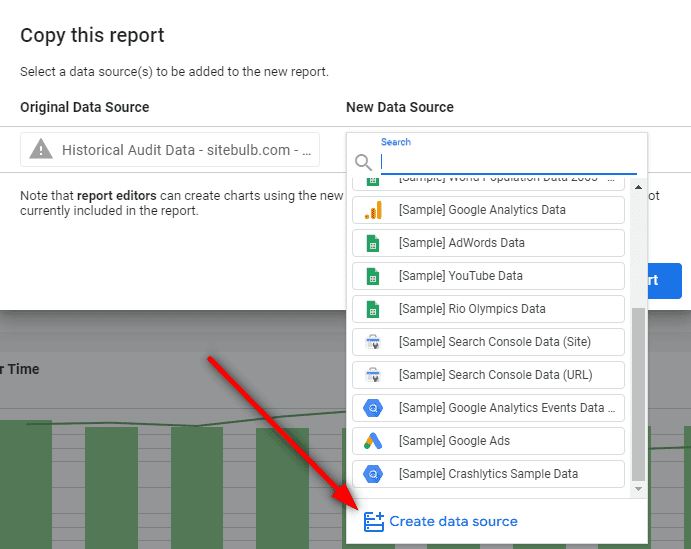
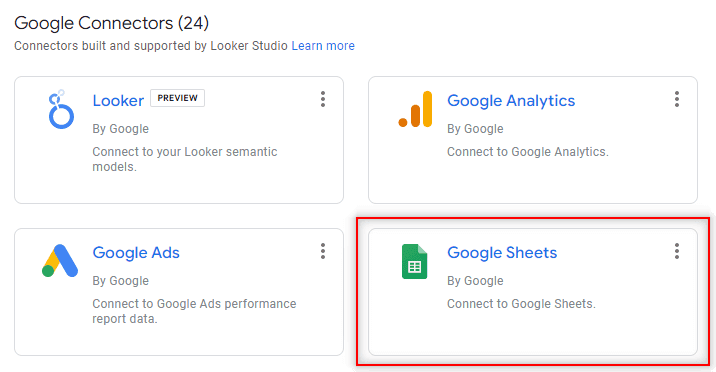
From the list of Google Connectors available, select Google Sheets.
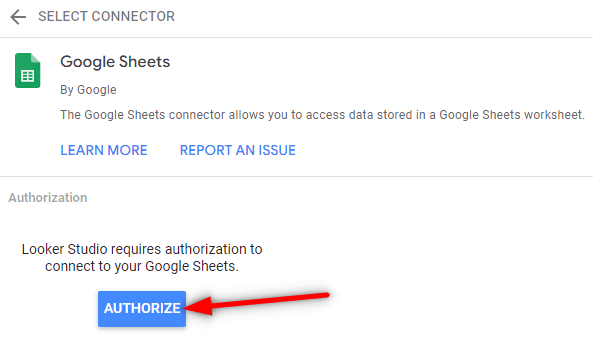
You'll need to authorize the connector, and as soon as you do this, Looker Studio will go off and fetch all of your sheet files.
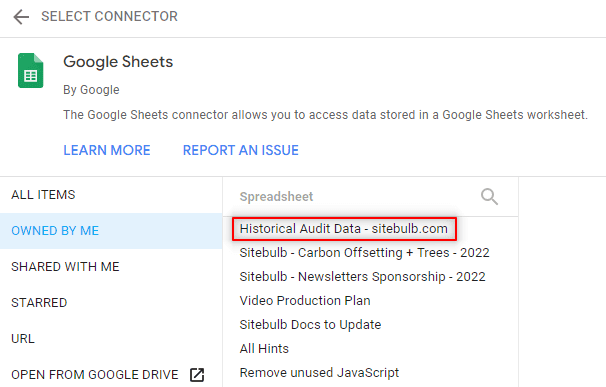
You then just need to locate and select the correct spreadsheet, which will be named using this format: 'Historical Audit Data - domain.' It may be that you have multiple projects for the same domain, so you may need to use the Open from Google Drive option and navigate to the right one.
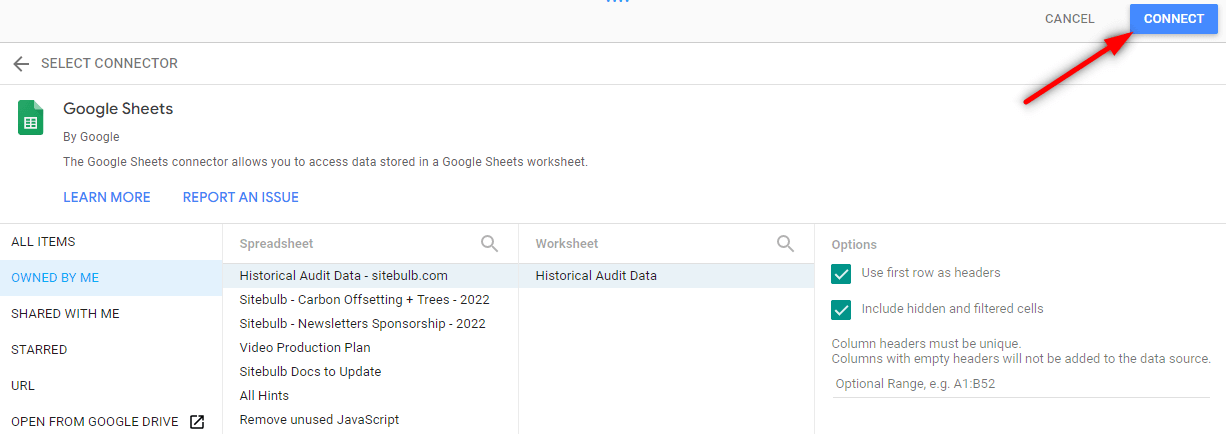
In this case it is simply the top option. Once selected, it will load in some extra options - just leave these all as default and click Connect.
This will take a minute to connect, and once it does you will be presented by an enormous long list of 'Dimensions' data.
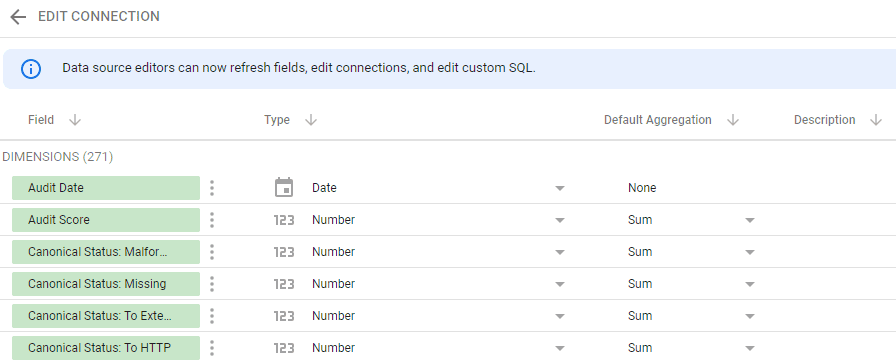
If you are fairly new to Looker Studio, then this may seem daunting, but there is no reason for it to. Every row you see on this screen simply reflects a column from the Google Sheet.
Each one represents a value you will find in a normal Sitebulb audit. If you toggle the 'Type' sort at the top, you will see that almost all of the values are numbers.
IMPORTANT NOTE: Looker Studio just guesses the 'Type' based on the data it finds in the spreadsheet. Sometimes it will guess incorrectly.
You may need to fix some of the types, but luckily this is quite intuitive and straightforward. In the example below, you can see that Looker has incorrectly decided that 'Audit Score' is a Date field. So it is just a case of using the dropdown options and switching this over to 'Number.' Don't worry about the Default Aggregation (this can either be 'None' or 'Sum', there will be no difference in your report).
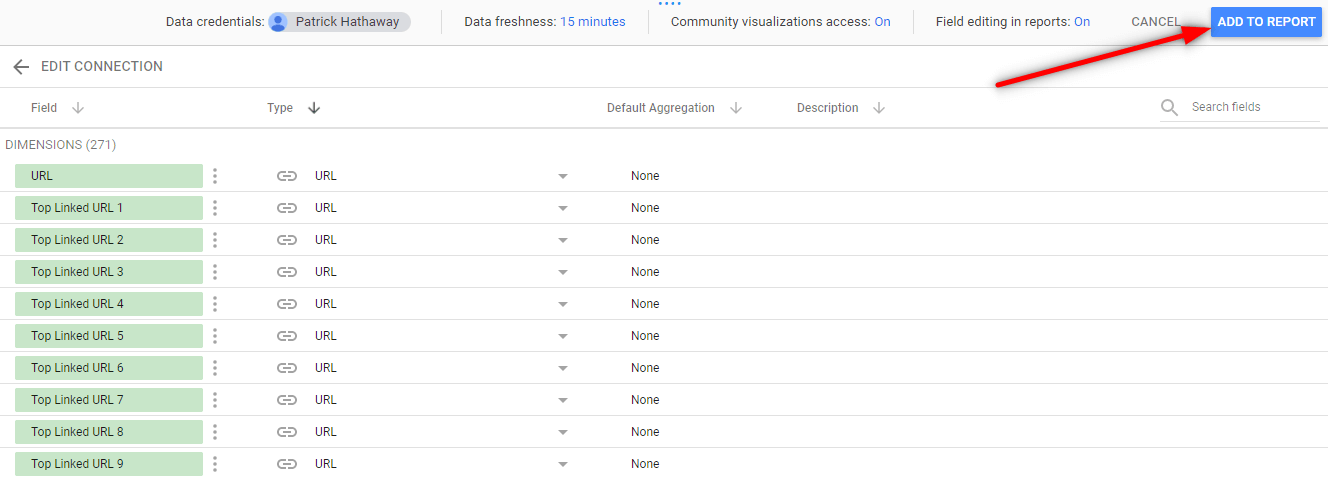
The types we use are actually kinda obvious once you look at them:
Normally you will have to change at least a couple of these because Looker has guessed wrong. Typically you will see some numeric fields are incorrectly classed as dates, so they will need to be switched back to number, like in the example above.
It is no issue if you miss some, you can edit the connection and fix them later on - but it does pay to sort the list a few times and eyeball them - it will save data issues further down the line (see the 'Troubleshooting' section at the bottom of this guide).
Finally, you are ready to hit Add to Report in the top right.
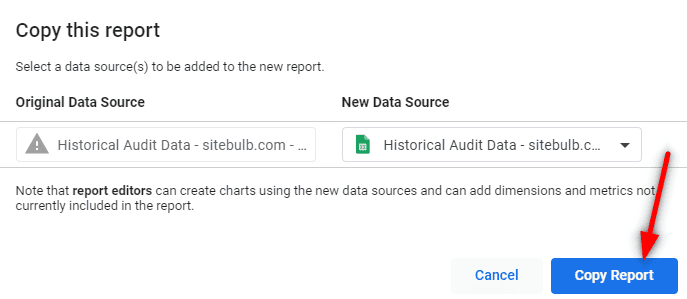
And now you'll be taken back to the 'Copy this report' modal, but this time your 'New Data Source' field will be populated, and you'll be able to hit Copy Report.
Now you'll see a version of our template, but with your audit data in it. It is worth pointing out that the Sitebulb template is designed to show monthly audit data, with most graphs and tables set to a 12 month lookback period.
In the example below, I added a project with only 3 months of audit data, so some bits of the report look a little sparse.
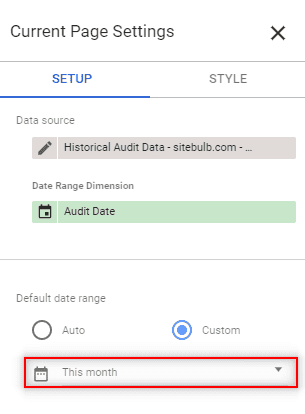
If you wish to build a weekly report instead of monthly, you'll need to edit the page settings (Page -> Current Page Settings -> Setup) and change the default date range to 'This week' instead of 'This month.' You need to do this for each page in turn.
The template includes a range of different ways to display the data, so we'll run through the different types and how they can be used.
The data available through the Historical Audit Data sheet is mostly aggregated URL counts across an audit (e.g. 'number of URLs that were 404'), which can be presented in Looker Studio in a variety of different ways.
Scorecards
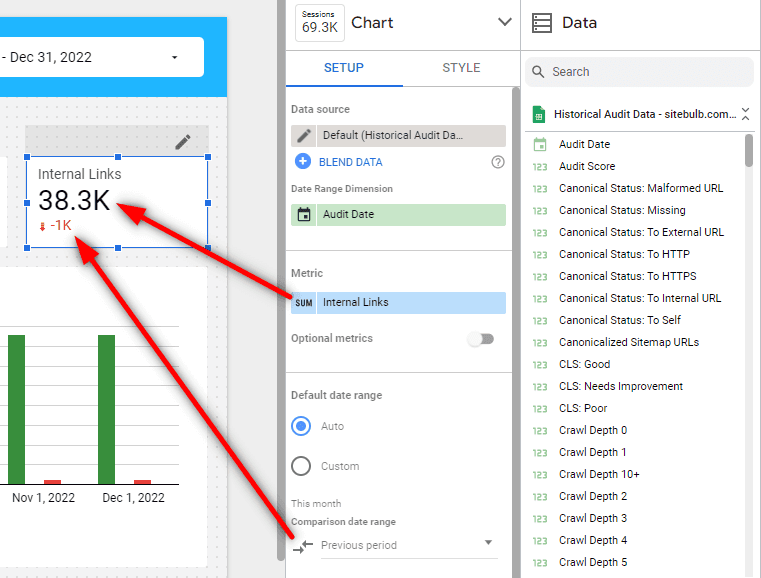
Scorecards offer a really straightforward way to display simple, single-value datapoints, like 'number of URLs.'
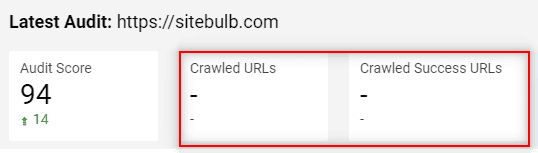
All of the fields on the right hand side are dimensions, but they can be used as metrics. So set the metric you wish to see in the scorecard (in this example, 'Internal Links'). This will show the total number of links from the most recent audit in the timeframe set in the top right.
You can also optionally add the comparison date range as 'Previous period' to see the change from the audit before.
'Over time' charts
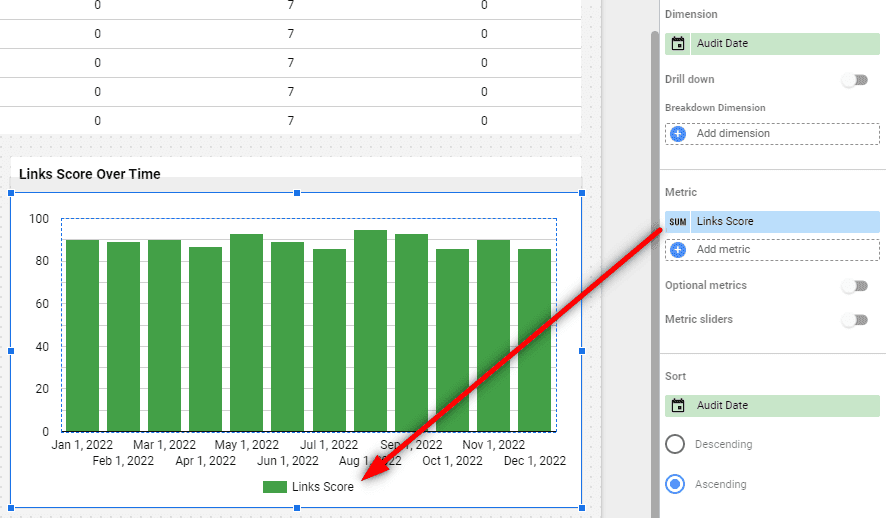
You can use bar charts to map a single metric over time, for example the audit or section scores, allowing you to show how the your scores have improved (or got worse!) as time passes.
You can do this by setting 'Audit Date' as the dimension, and then selecting a single metric (in this example, 'Links Score'):
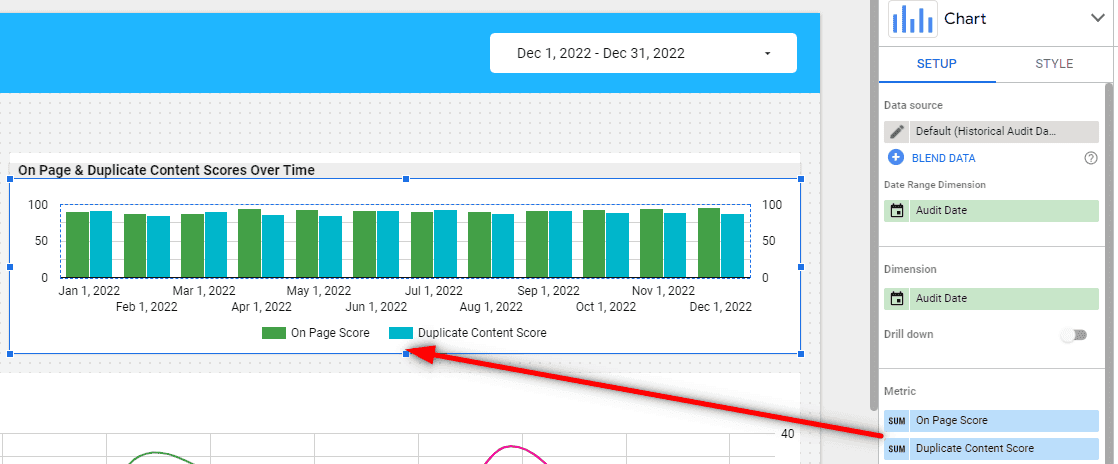
You can also chart multiple metrics at once, by again selecting 'Audit Date' as the dimension, and then adding multiple metrics:
Of course there are lots of other chart options that work well with time-series data, such as this line-bar combo chart:
Or this line chart:
In each case, the important thing is that the dimension is set to 'Audit Date' and you add numeric metrics.
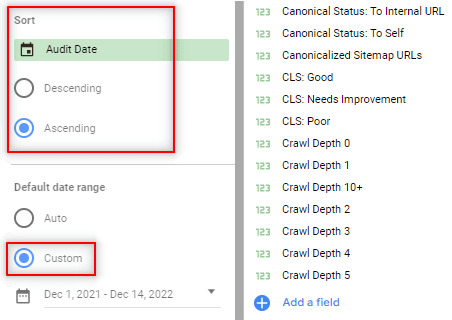
Additionally, you can control how your data displays by adjusting the 'Sort' and 'Default date range' options:
'Over time' tables
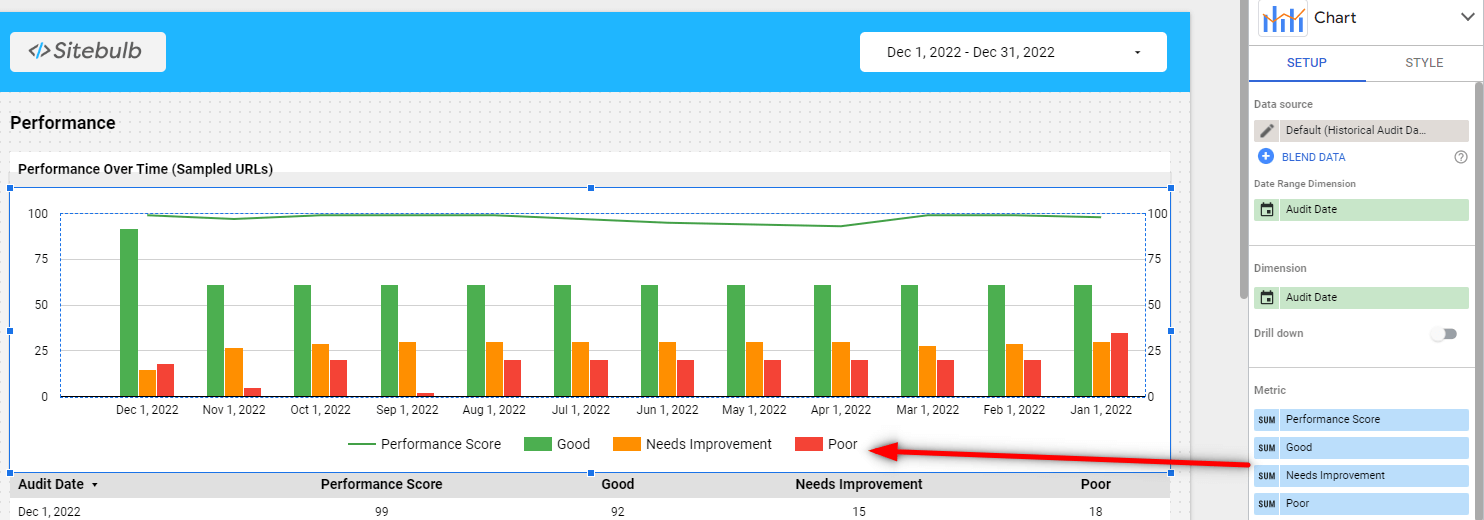
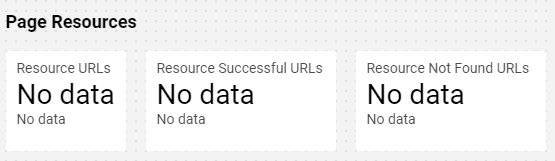
The same concept can be used for showing data changes over time in a table format, such as the one we have in the 'Performance' section;
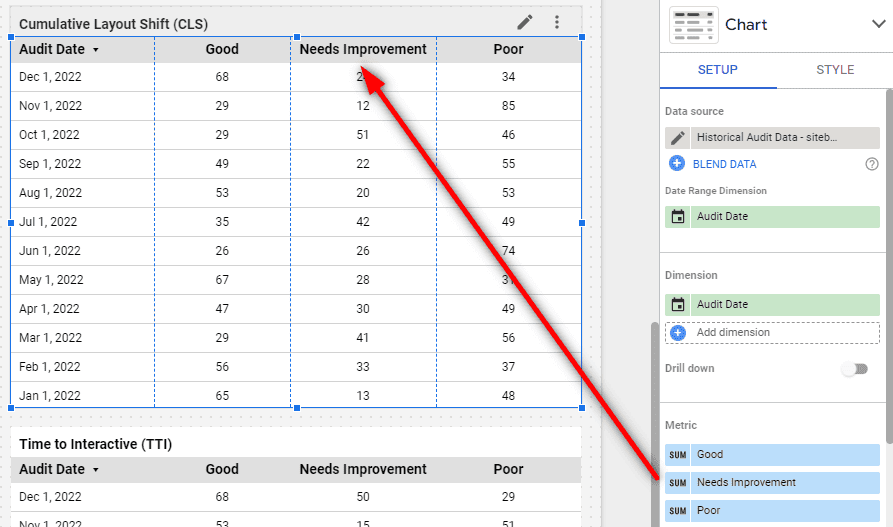
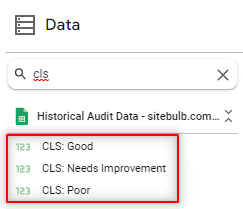
In this case, we have 'Audit Date' as the dimension and then selected comparable metrics from the list of available metrics:
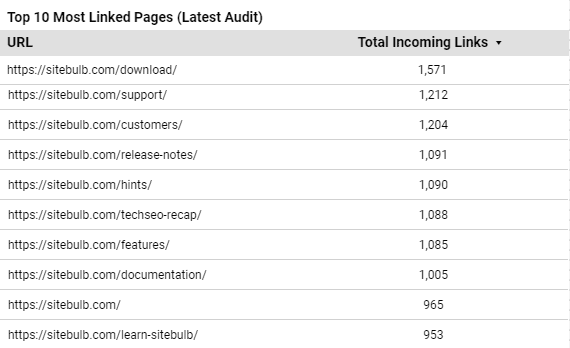
Top Linked Pages
So far we have looked at purely numeric data - either audit scores or URL counts. However in the Historical Audit Data sheet we also provide the top linked pages, and their corresponding linked counts. So these are the top 10 internal HTML URLs in terms of incoming internal links.
Presenting this sort of data like this is a little bit hacky, to be honest, as this type of data should really live in an array, but this is the limitation of a 'flat' Google Sheet - where all the data has to fit on a single row.
As a result, the pleasant looking table above is also a bit of a hack, as it is actually 10 tables on top of 1 another, each showing a single record!
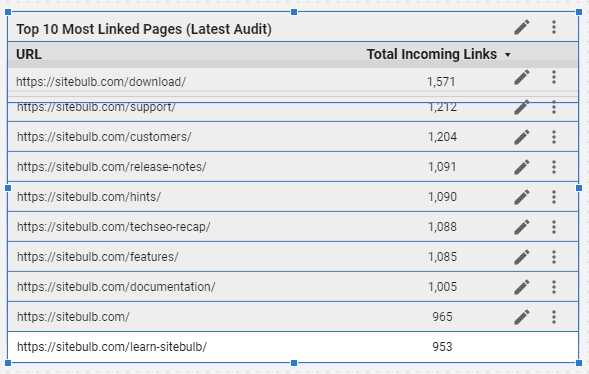
Despite this, it still performs the intended function.
Note that that URLs themselves - and the link counts - may change from audit to audit if changes are made to the website.
From our experience of Looker Studio (even waaaay back in the Google Data Studio days), it can be somewhat...temperamental.
Data can be there, and then you click a box, and it all completely disappears. Or it is working one minute, you go to make a cup of tea, only to come back and see errors all over your screen.
We don't know why it is like this, but it is. And it's like this for everything - it's nothing to do with Sitebulb.
With that established, here are our favourite tricks to kick it back into line:
Refresh data
When in Edit mode, navigate to View in the top navigation and then select Refresh data.
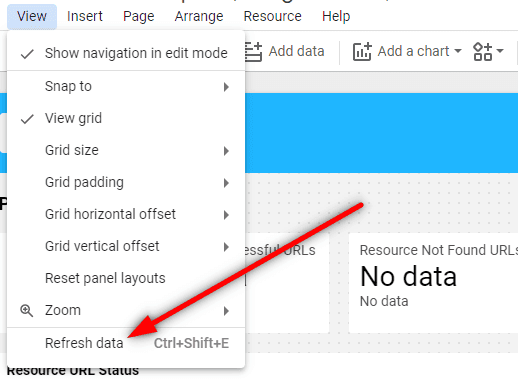
This will force Looker Studio to go and fetch the data again from the sheet, and is typically the first thing to try when the data looks off.
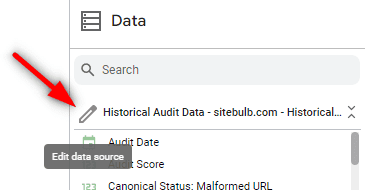
Reconnect the data source
This is the Looker Studio version of 'turn it off and turn it back on again.'
You need to get back to the section where you set up the data source. There are multiple ways to get there, but this (I think) is the quickest. On the right hand side, hover over the data source, and it should change to a 'pen' hover state - click this.
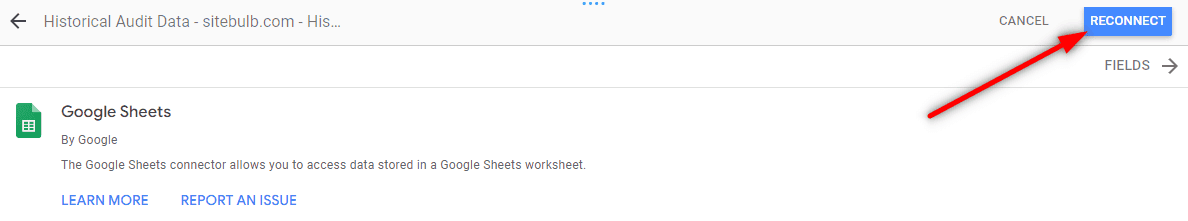
Then you'll be on the page with the big long list of dimensions. Click Edit Connection on the left.
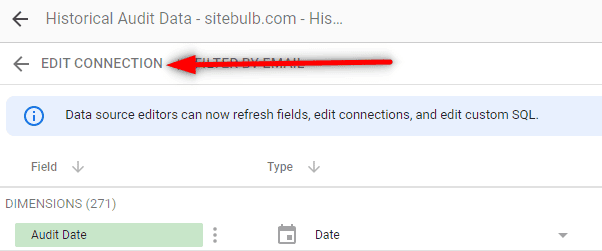
Then - without actually changing anything - click the blue Reconnect button on the far right.
Despite the fact that you and I both know you didn't actually change anything, Looker Studio may try to claim you did. Just humour it and apply the connection changes:
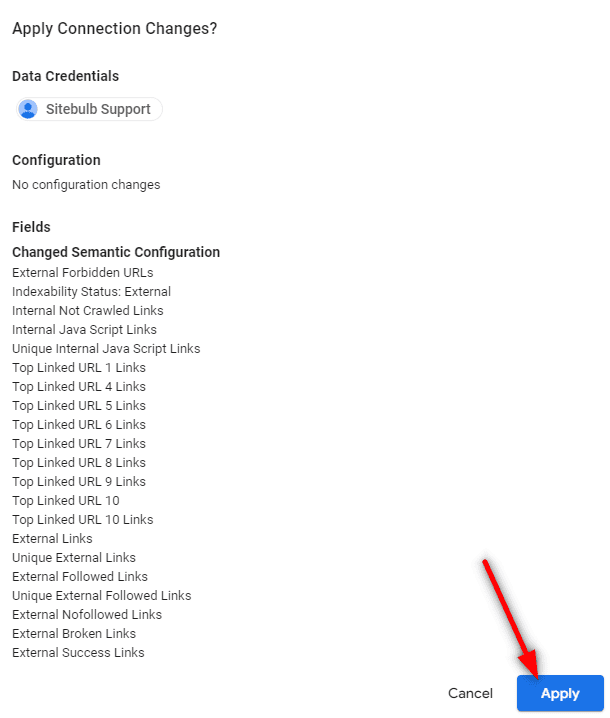
It may at this point decide that some of your Number fields should be Dates again, so it is worth sorting by 'Type' and double checking if any of them need to be changed back.

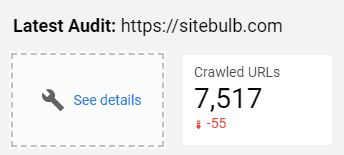
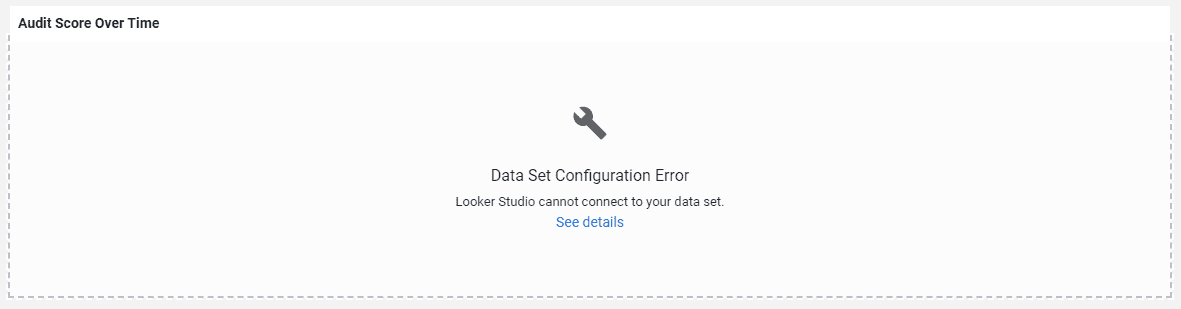
If the fields are not set up with the expected type, this will cause 'see details' type errors:
And in some cases 'configuration errors':
Check the spreadsheet
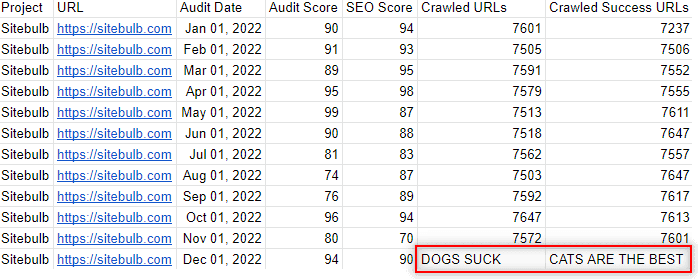
It is worth remembering that the source of data is the Historical Audit Data sheet. So if a particular metric is not showing up in your Looker report, go check the sheet and make sure the data is correct in there. Your cat might have stepped on your keyboard or something.
Check the sheet... lo and behold;
Another reason why data might be missing is that you did not have the audit option switched on, or no data was found during the audit (e.g. 'International' switched on, for a site with no hreflang). If you remain sure that the data should be there, go and check the audit itself in Sitebulb to double check.
Remember that Sitebulb will just spit out every single column regardless of the audit options you selected, and you should not manually edit the spreadsheet yourself - otherwise you'll end up in the same situation as above when your cat got the keyboard.
Check the date
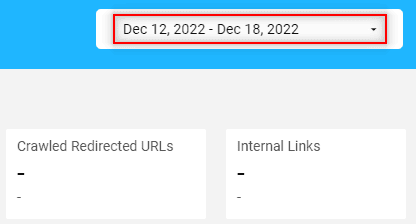
It is easy to accidentally mess up the date range, which will cause data to not display. For example, if I change the date range to 'this week', but the last audit that actually ran was over a week ago, Looker will not display any data;
The inverse can also be true, if you choose a date range to span a time when multiple audits will have been completed;
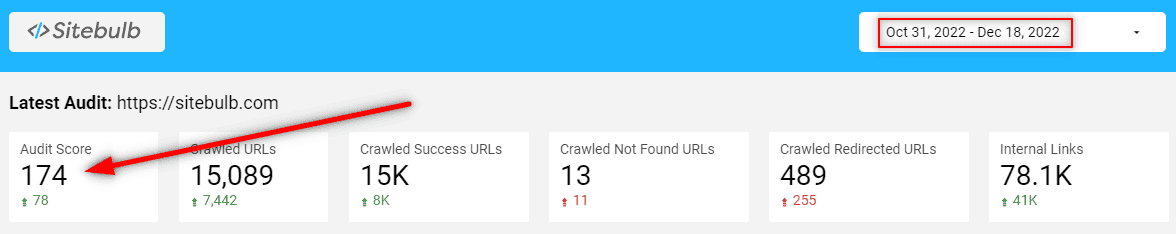
What happens in this case is that two audits were completed during the time frame set, and so Looker Studio has summed the values. Why? Because, when Looker Studio brings in all the numeric data, it sets the default aggregation to 'Sum.' Also, if the default aggregation is 'None', it will also default to 'Sum.'
The way to avoid this is simply to ensure that the date range you have selected in your Looker Studio report matches the cadence of your recurring audit (i.e. weekly-> 'this week', monthly -> 'this month' etc...).
This guide explains how to get your Sitebulb audit data into Looker Studio, so you set up scheduled audits and benefit from a fully automated workflow.
Hopefully our template does a good job of demonstrating what sort of thing is possible, so you can have fun building out your own dashboards!