


Beyond Cosine Similarity: Testing Advanced Algorithms for SEO Content Analysis
 Mikael Araújo
Published January 5, 2026
This week, we are grateful to Mikael Araujo who shares the results of their similarity algorithm testing. A super-interesting read for the technically minded!
The SEO community has embraced semantic similarity analysis as the new frontier for content optimization, duplicate detection, and relevance scoring. Screaming Frog's integration with Google Gemini embeddings uses cosine similarity as the default algorithm, but is this always the best choice?
We tested four different algorithms using Google Gemini embeddings to reveal measurable performance differences (3.5% separation advantage for Manhattan distance) that could impact your content analysis accuracy.
In this article, I break down our findings.
Contents:
The current state of similarity algorithms in SEO
Most SEO professionals rely on cosine similarity without questioning whether it's optimal for their specific use case. I want to start by exploring how the industry adopted this approach and why it became the standard.
Key points I’m going to cover:
Screaming Frog's semantic analysis feature with 0.95 similarity thresholds
Industry adoption following iPullRank's pioneering work on semantic SEO
The gap between "what everyone uses" and "what works best"
What are embeddings and why do they matter for SEO?
Before diving into similarity algorithms, SEO professionals need to understand the foundation: what embeddings actually are and why they're revolutionizing content analysis.
Understanding embeddings in simple terms
Think of embeddings as a way to convert text into numerical coordinates in a multi-dimensional space. Just like GPS coordinates pinpoint a location on Earth, embeddings pinpoint the "meaning location" of your content in semantic space. When the Google Gemini API processes the text "Learn SEO fundamentals," it transforms those words into 3,072 numbers that capture the semantic essence.
The semantic space concept
In this mathematical space, similar concepts cluster together. Pages about "keyword research" and "on-page optimization" will have embeddings positioned closer to each other than to pages about "e-commerce checkout optimization." This clustering happens automatically based on the relationships the AI model learned from analyzing billions of web pages.
Why embeddings solve traditional SEO challenges
Traditional keyword-based analysis misses semantic relationships. A page about "car" and another about "automobile" would appear unrelated to simple text matching, but embeddings recognize they occupy similar semantic territory. This addresses three critical SEO needs:
Semantic content gaps: Identify missing topics in your content strategy
True duplicate detection: Find pages that cover the same concepts regardless of wording
Content relevance scoring: Measure how well pages align with target topics
Understanding cosine similarity: the current SEO standard
Cosine similarity has become the default choice for measuring content relationships in SEO tools, but understanding why requires grasping what it actually measures.
What cosine similarity calculates
Imagine two arrows (vectors) pointing from the origin in our semantic space. Cosine similarity measures the angle between these arrows, ignoring their length. A score of 1.0 means the arrows point in exactly the same direction (identical semantic meaning), while 0.0 means they're perpendicular (completely unrelated topics).
Why cosine similarity works well for text
Text embeddings have a unique property: their magnitude (length) often correlates with content volume rather than semantic meaning. A 50-word meta description and a 2,000-word blog post about the same topic should be considered similar despite their length difference. Cosine similarity focuses on semantic direction while ignoring magnitude, making it ideal for comparing content of different lengths.
Practical SEO applications:
Duplicate content detection: Pages with cosine similarity > 0.95 likely cover identical topics
Content cluster analysis: Group related pages with similarity scores > 0.75
Competitive gap analysis: Compare your content's semantic positioning against competitors
Internal linking opportunities: Connect pages with moderate similarity (0.6-0.8) for topical relevance
Screaming Frog’s integration with Google Gemini embeddings uses cosine similarity with 0.95 thresh olds. I t provides intuitive similarity scores (0-1 range) and handles the variable content lengths common in SEO audits. Most SEO professionals find cosine similarity scores easier to interpret than distance-based metrics.
Understanding the similarity algorithm landscape
While cosine similarity dominates SEO tools, several alternative algorithms offer different approaches to measuring content relationships. Each captures different aspects of semantic similarity that may better suit specific SEO applications.
Algorithm categories and their SEO relevance
1. Distance-based methods: measuring semantic "proximity" in content space
Think of your content as houses scattered across a city. Distance-based algorithms calculate how far apart these content "houses" are from each other in semantic space.
Euclidean distance: the straight-line measurement
Euclidean distance calculates the direct, "as-the-crow-flies" distance between two pieces of content in multi-dimensional space. Imagine stretching a measuring tape directly between two houses, ignoring streets, buildings, or terrain.
Mathematical foundation: For two content pieces with embeddings A and B, Euclidean distance is √[(A₁-B₁)² + (A₂-B₂)² + ... + (Aₙ-Bₙ)²] - essentially the Pythagorean theorem extended across thousands of dimensions.
SEO example: A blog post about "keyword research tools" and another about "competitor analysis software" might have a small Euclidean distance because they occupy similar semantic territory (both about SEO tools), even if they use completely different vocabulary.
Manhattan distance: the city-block measurement
Manhattan distance calculates the path you'd actually take if you had to travel between content "houses" using only semantic "streets" - no diagonal shortcuts allowed.
Mathematical foundation: For embeddings A and B, Manhattan distance is |A₁-B₁| + |A₂-B₂| + ... + |Aₙ-Bₙ| - the sum of absolute differences across all dimensions.
SEO insight from our testing: Manhattan distance achieved superior category separation (1.081 vs cosine's 1.044) because it's more sensitive to subtle topic variations. Where cosine similarity might rate "technical SEO audits" and "website performance analysis" as highly similar, Manhattan distance detected nuanced differences that proved valuable for content organization.
2. Correlation-based methods: finding content patterns
Pearson correlation looks for linear relationships between content dimensions, identifying patterns in how topics relate across your content ecosystem.
Pearson correlation example: Consider analyzing your entire blog's content embeddings. Pearson correlation might reveal that whenever your content scores high on "technical SEO" dimensions, it also scores high on "website performance" dimensions, showing a consistent content pattern. This helps identify your site's natural topic clusters and content strengths.
SEO applications: Particularly valuable for sequential content analysis (does your content flow logically from basic to advanced topics?), identifying your site's topic authority patterns, and planning content series that build on each other effectively.
3. Vector-based methods: the current standard
Cosine similarity measures the angle between content vectors, focusing on semantic direction while ignoring content length variations.
Cosine similarity example: Two pages might have very different word counts - a 200-word meta description and a 2,000-word comprehensive guide - but if they're both about "local SEO strategies," cosine similarity recognizes their semantic alignment regardless of length difference. The algorithm sees them as arrows pointing in the same semantic direction.
SEO applications: This length-agnostic property makes cosine ideal for comparing diverse content types (product pages vs blog posts vs landing pages) and forms the backbone of most semantic SEO tools today.
Real-world comparison with SEO content
To illustrate how these algorithms work differently, consider analyzing these three hypothetical page titles:
"Complete Guide to Technical SEO Audits"
"How to Perform Website Technical Analysis"
"Best E-commerce Product Page Optimization Tips"
Cosine similarity would rate pages 1 and 2 as highly similar (both about technical analysis) while marking page 3 as different
Manhattan distance might detect subtle differences between "audits" and "analysis" that cosine misses, providing more nuanced similarity scoring
Pearson correlation could reveal that all three pages share underlying "optimization" patterns, suggesting they belong in the same content cluster despite surface-level differences
Why this matters for SEO strategy
Different algorithms excel at different content relationships. Cosine similarity dominates because it handles length variations well, but our testing revealed Manhattan distance achieving superior category separation.
Understanding these differences helps SEO professionals choose the right tool for specific analysis needs - whether detecting true duplicates, planning content clusters, or identifying optimization opportunities.
Methodology: testing similarity algorithms with real SEO content
Our testing methodology ensures practical relevance for SEO professionals working with diverse content types.
Our methodology is fully reproducible: We tested four similarity algorithms against a controlled dataset of 50 text samples across five content categories, using Google Gemini's production API with the exact parameters (models/gemini-embedding-001, task_type="SEMANTIC_SIMILARITY") that match Screaming Frog's implementation.
Every step, from dataset creation to statistical analysis, is documented with open-source Python code that any SEO team can replicate. The complete methodology, raw data, and analysis scripts are available for download, ensuring transparency and enabling others to validate or extend our findings.
Dataset composition and methodology specifics
Our analysis used 50 unique text snippets (approximately 150 characters each) representing real SEO content scenarios - not 50 URLs, but rather the semantic essence of what those URLs contain. Each snippet simulates the kind of content you'd analyze in tools like Screaming Frog: page titles, meta descriptions, and content summaries that capture a page's topical focus.
Testing framework with clear definitions
Separation ratio analysis: Measures how well each algorithm distinguishes content within the same topic category versus content from different categories (higher ratios indicate better topic discrimination)
Clustering performance metrics: Statistical measures that evaluate how accurately each algorithm groups similar content together, using established methods from machine learning research
Visual analysis through dimensionality reduction techniques like t-SNE: Converting high-dimensional embeddings into 2D plots
Practical similarity threshold evaluation: Testing different cutoff points to determine when content should be considered "similar enough" for SEO applications
Results: unexpected winner, but cosine remains practical default
Our comprehensive testing reveals clear performance differences that impact real-world SEO applications.
Performance ranking by separation ratio with baseline context: To understand these results, you need to grasp what each metric means for SEO content analysis:
Separation ratio explained: This measures how well an algorithm distinguishes content from the same topic category versus content from different categories. Think of it as "signal-to-noise ratio" for semantic analysis. A ratio of 1.0 means the algorithm can't tell the difference between related and unrelated content. Higher ratios indicate better topic discrimination.
Within-category vs between-category similarity baseline:
Within-category similarity: How similar content pieces are when they belong to the same topic (e.g., all your "technical SEO" posts compared to each other)
Between-category similarity: How similar content pieces are when they belong to different topics (e.g., your "technical SEO" posts compared to your "social media marketing" posts)
Our results interpreted:
Manhattan distance: 1.081 (within: 0.035, between: 0.033). As Figure 1 illustrates, this superior separation is visible in the almost entirely dark purple matrix with minimal off-diagonal similarity.
Translation: Content from the same category is only 8.1% more similar than content from different categories - but this small difference proved statistically significant across our dataset
Cosine similarity: 1.044 (within: 0.803, between: 0.769)
Translation: Same-category content averages 80.3% similarity while different-category content averages 76.9% similarity - a 4.4% performance edge
Pearson correlation: 1.044 (within: 0.803, between: 0.769)
Translation: Performed identically to cosine similarity, suggesting both capture similar semantic patterns in our test data
Euclidean distance: 1.032 (within: 0.615, between: 0.596)
Translation: Showed the smallest performance gap, making it less reliable for distinguishing content categories
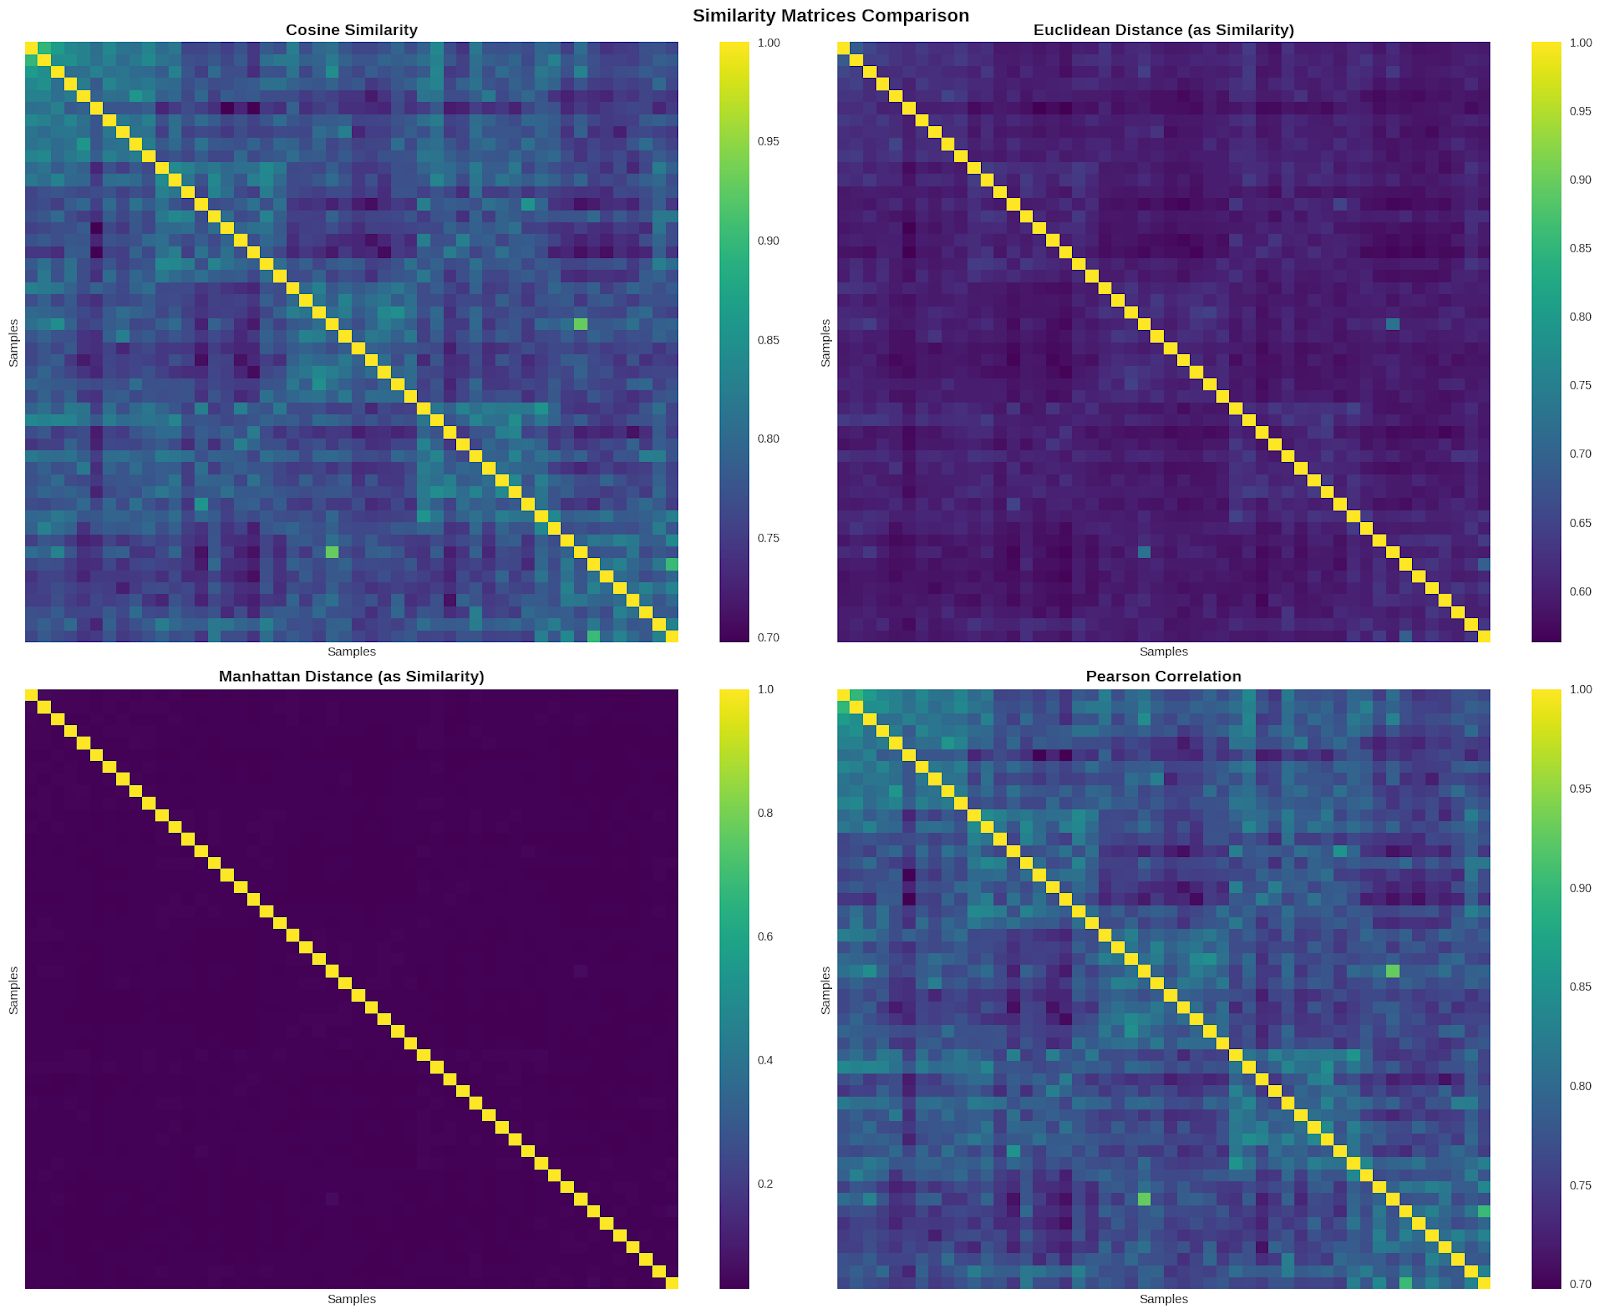
Figure 1: Visual comparison of similarity matrices across four algorithms.
“Cosine similarity and Pearson correlation show similar patterns with clear diagonal blocks indicating within-category similarity. Manhattan distance displays the strongest separation with minimal off-diagonal similarity, explaining its superior separation ratio (1.081). Euclidean distance shows intermediate performance. Brighter colors indicate higher similarity between content pairs.”
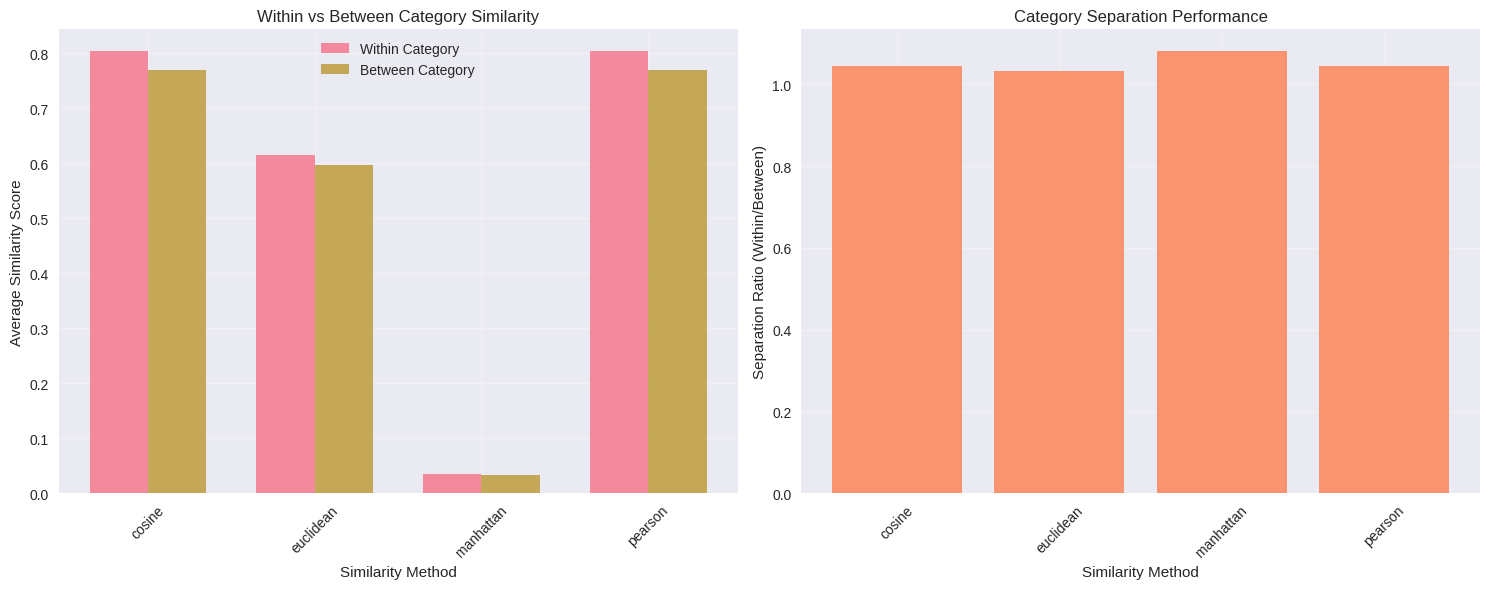
Figure 2: Performance comparison across algorithms.
“Left panel shows average similarity scores within categories (pink) versus between different categories (gold). Note that Manhattan distance operates on a different scale (0.03-0.04 range) compared to cosine and Pearson (0.75-0.80 range). Right panel displays separation ratios where higher values indicate better category discrimination. Manhattan achieves the highest ratio (1.081), followed by cosine and Pearson (both 1.044), with Euclidean trailing at 1.032.”
Surprising key findings:
Manhattan distance unexpectedly outperforms cosine similarity for category separation
Real embeddings show much smaller performance gaps between algorithms
Cross-category semantic overlap is significant (0.769-0.803 similarity ranges)
Clustering is more challenging with real data (ARI: 0.332 vs perfect simulation)
All algorithms detect genuine semantic relationships across categories
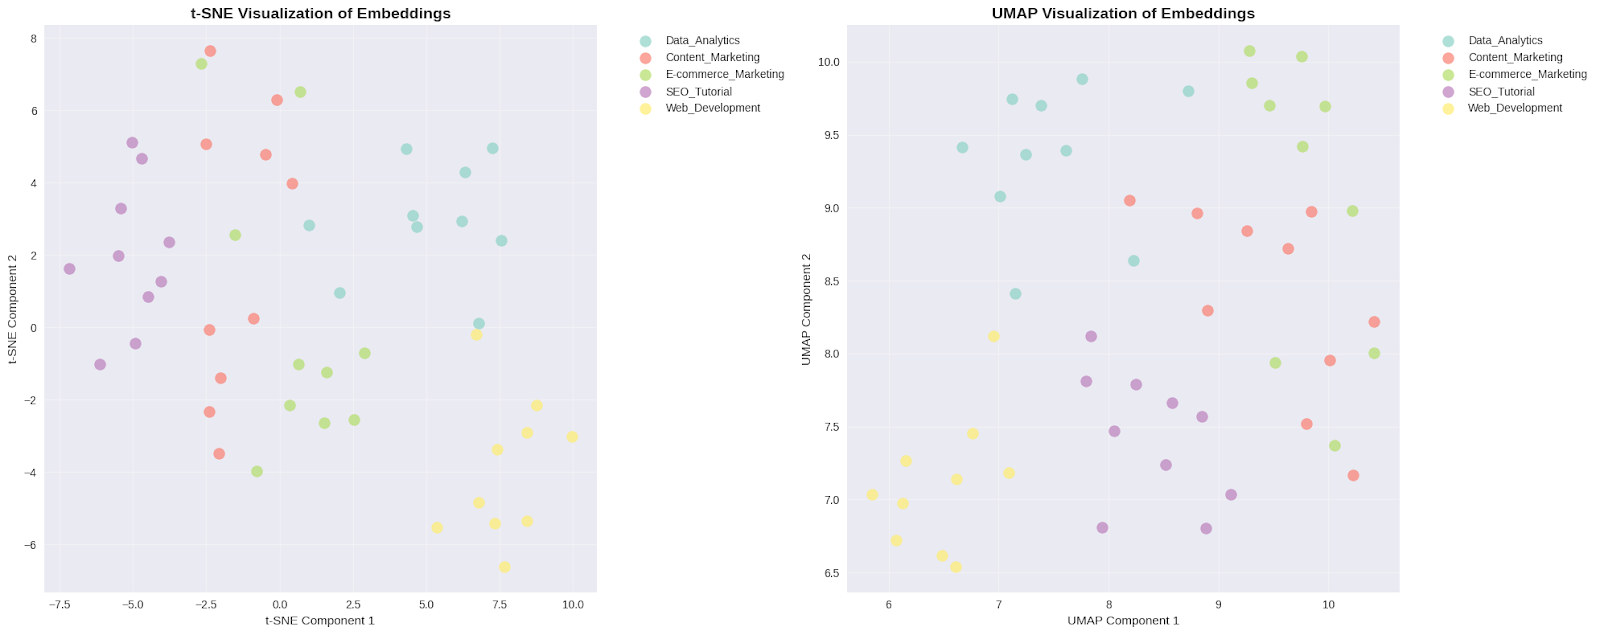
Figure 3: Dimensionality reduction visualizations of content embeddings.
“Both t-SNE (left) and UMAP (right) projections show partial separation of the five content categories with notable overlap, particularly between Web Development (green) and Data Analytics (cyan) topics. This overlap reflects genuine semantic relationships in SEO content - for example, SQL optimization is relevant to both web developers and data analysts. The clustering pattern explains the moderate Adjusted Rand Index (0.332) and demonstrates that perfect category separation is neither expected nor desirable for real-world content analysis.
These visualizations reveal why clustering performance was moderate (ARI: 0.332) - there's genuine semantic overlap between content categories in real SEO content, particularly between related topics like Web Development and Data Analytics (both discuss database optimization and SQL).
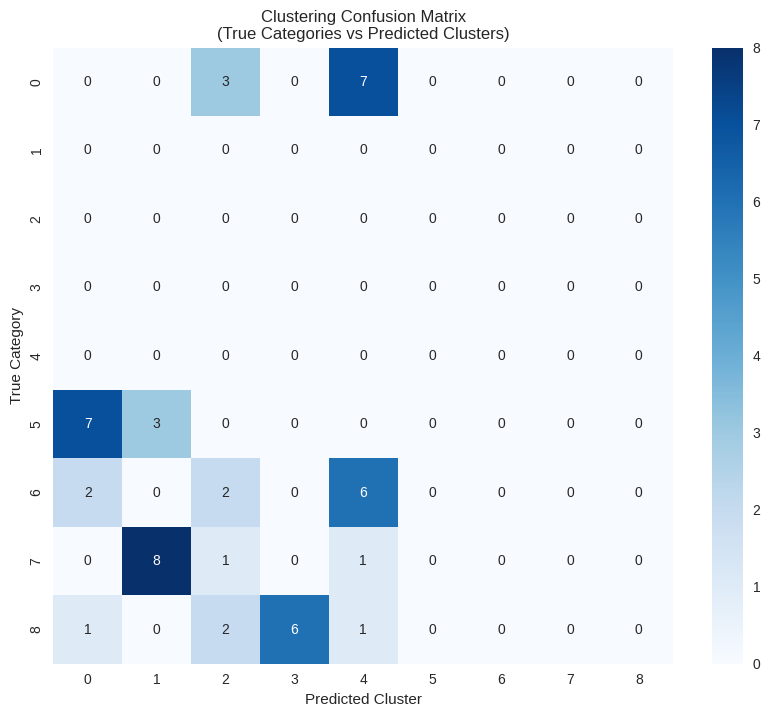
Figure 4: Clustering confusion matrix showing alignment between true content categories and K-means predicted clusters. Darker blue cells indicate stronger cluster assignment. Category 7 (Content Marketing) shows the cleanest clustering with 8 of 10 items correctly grouped together (cluster 1). Category 5 split between clusters 0 and 1, while category 6 distributed across clusters 2 and 4. The fragmentation pattern explains the moderate Adjusted Rand Index (0.332) - categories with overlapping semantic topics naturally resist perfect separation. For SEO professionals, this demonstrates that some content ambiguity is inherent and algorithms cannot force artificial boundaries where semantic overlap exists.
Interestingly, not all content categories fragment equally. Category 7 (likely Content Marketing based on our dataset) maintained 80% cluster purity, suggesting its semantic profile is distinct from other categories. In contrast, categories 5 and 6 scattered across multiple clusters, indicating these topics share semantic features with multiple other categories - exactly what we'd expect from interconnected SEO topics like "technical SEO audits" and "website performance optimization.”
The confusion matrix confirms this overlap pattern: while some categories clustered cleanly (category 7 achieved 80% purity in cluster 1), others fragmented across multiple clusters due to semantic similarities. This imperfect clustering reflects the reality of SEO content analysis - pages about SQL optimization could legitimately belong to both Web Development and Data Analytics categories.
What these results mean for SEO professionals
The performance differences have practical implications for common SEO tasks, but understanding the benefits requires clear explanations of how these improvements translate to everyday workflows.
For duplicate content detection
Manhattan distance's superior separation (1.081) provides nuanced detection, but cosine similarity's interpretable scores (0-1 range) reduce implementation complexity:
ELI5: Manhattan distance achieved the best category separation in our testing, meaning it's slightly better at distinguishing truly different content from similar content. However, cosine similarity produces scores between 0 and 1 that are immediately intuitive - 0.95 clearly means "95% similar" - while Manhattan produces tiny decimal values (0.035 vs 0.033) that require calibration to interpret meaningfully.
Why we still recommend cosine despite Manhattan's lead:
While Manhattan achieved 3.5% better separation, cosine similarity offers three practical advantages that justify its continued use: (1) intuitive 0-1 scoring that SEO teams can interpret without training, (2) universal tool support across platforms like Screaming Frog, and (3) established thresholds (>0.95 for duplicates, >0.75 for clusters) that have proven reliable in production environments.
Higher confidence in identifying semantically similar pages:
ELI5: Like having a more accurate radar system, better separation gives you more certainty when algorithms flag potential duplicate content. Instead of getting matches that might be duplicates, you get matches that almost certainly are duplicates, allowing you to act decisively rather than second-guessing every recommendation.
More reliable thresholds for automated content auditing:
ELI5: Imagine setting your car's cruise control. With a reliable algorithm, you can confidently set automatic rules like "flag any content with 95% similarity as potential duplicates" and trust the system to work correctly. Unreliable algorithms force you to constantly adjust these settings or manually check everything.
For content relevance scoring:
Better distinction between on-topic and off-topic content
More accurate identification of content outliers
Improved content cluster visualization
For competitive analysis:
Clearer differentiation between your content and competitors
More precise similarity scoring for content gap analysis
When to consider alternative algorithms
Despite cosine similarity's strong performance, specific scenarios may benefit from alternative approaches.
Understanding Pearson correlation: identical performance, complementary insights
Before diving into when to use Pearson correlation, it's essential to understand what our testing revealed and what this algorithm actually measures.
What our testing showed:
Our testing revealed that Pearson correlation achieved identical separation performance to cosine similarity (both 1.044 with within-category: 0.803, between-category: 0.769). However, despite matching cosine's overall performance, Pearson measures relationships differently - focusing on linear correlations rather than angular similarity. This distinction means that while both algorithms perform equally well at category separation, they can surface different insights about content relationships.
What Pearson correlation is:
Unlike cosine similarity which measures the angle between content vectors, Pearson correlation measures how consistently two pieces of content vary together across all semantic dimensions. Think of it like measuring whether two content pieces "move in sync" - when one scores high on certain semantic features, does the other also score high on those same features?
Visual anchor for understanding:
Imagine plotting your content on a graph where the X-axis represents "technical complexity" and the Y-axis represents "user actionability." Pearson correlation would measure if there's a consistent relationship: do your most technical articles also tend to be your most actionable, or is there no pattern? This relationship analysis extends across all 3,072 embedding dimensions simultaneously.
When Pearson correlation provides complementary insights despite identical separation:
Better for identifying linear relationships in content patterns:
When you want to understand if your content follows predictable progressions (basic → intermediate → advanced topics), Pearson correlation excels at detecting these sequential relationships. Even though it didn't outperform cosine in our category separation test, it can reveal progression patterns that cosine's angular measurement might miss.
Useful when analyzing content progression or sequences:
If you're building content funnels or educational sequences, Pearson correlation can identify which pieces naturally flow together based on their semantic progression patterns, even when cosine similarity suggests they're equally related to other content.
May reveal hidden correlations in content performance:
Sometimes content that seems topically different actually performs similarly because they share underlying structural patterns. Pearson correlation can surface these hidden relationships that inform content strategy decisions - relationships that might not be apparent from cosine similarity scores alone.
The practical takeaway:
Since Pearson and cosine performed identically in separation (1.044), the choice between them depends on what type of relationship you're analyzing rather than which performs "better." Use cosine for general similarity detection, but consider Pearson when analyzing content sequences, progressions, or looking for correlated patterns across your content library.
Distance-based methods: step-by-step implementation guide
Step 1: Identify your use case
Use Manhattan distance for: detecting subtle content overlaps, identifying pages that might be competing for similar keywords, content audit cleanup
Use Euclidean distance for: general outlier detection, finding content that doesn't fit your site's theme
Step 2: Set appropriate thresholds
Manhattan distance scores are typically very small (0.01-0.10 range), so don't expect cosine-like scores of 0.8+
Start with relative comparisons: identify your top 10% most similar pairs rather than using absolute thresholds
Validate thresholds by manually reviewing a sample of flagged content pairs
Step 3: Integrate with existing workflow
Export your current Screaming Frog semantic analysis data
Apply alternative algorithms to the same embedding data
Compare results side-by-side with your existing cosine similarity analysis
Document cases where alternative algorithms provide actionable insights that cosine missed
Practical implementation guide
Step-by-step guidance for SEO professionals wanting to test or implement these algorithms.
Using Screaming Frog:
Current cosine similarity implementation remains optimal
Understanding threshold adjustment based on our findings
Interpreting similarity scores with greater confidence
Custom implementation:
Python code examples using scikit-learn and our tested methodology
Google Colab setup for SEO teams without technical resources
Integration with existing SEO workflows
Tool selection criteria:
When to stick with default cosine similarity
Scenarios requiring custom algorithm testing
Building internal consensus around algorithm choice
Advanced considerations for large-scale implementation
For enterprise SEO teams and advanced practitioners considering custom implementations, scale introduces specific challenges that can quickly overwhelm systems and budgets.
The brutal reality of computational scale: Processing semantic similarity at scale isn't just "more of the same" - it's fundamentally different. When you move from analyzing 100 pages to 100,000 pages, you're not dealing with 1,000 times more work; you're dealing with exponential complexity increases that can crash even robust systems.
Memory and processing challenges that will break your setup:
Similarity matrix explosion: Comparing 10,000 pages requires calculating 49,995,000 similarity pairs. Each pair consumes memory, and the full matrix can easily exceed 100GB+ of RAM
API rate limiting reality: Google Gemini embeddings have strict rate limits. Processing a large enterprise site could take days or weeks if not properly batched and managed
Embedding storage requirements: 10,000 pages × 3,072 dimensions × 8 bytes per float = ~240MB just for raw embedding storage, before any processing overhead
Real-world scaling bottlenecks and solutions:
Batch processing strategies: Never process embeddings one-by-one; batch in groups of 50-100 to maximize API efficiency while respecting rate limits
Similarity calculation optimization: Use approximate nearest neighbor libraries like FAISS or Annoy instead of calculating full similarity matrices
Progressive analysis approaches: Start with page clustering to identify natural content groups, then run detailed similarity analysis within clusters rather than site-wide comparisons
Future directions in SEO similarity analysis
The rapidly evolving landscape of semantic analysis tools and techniques requires understanding the broader context of why these developments matter and how they'll reshape SEO strategy.
Why the semantic revolution matters now: We're witnessing the most fundamental shift in content analysis since the invention of keyword density. Search engines are moving away from matching exact words to understanding meaning and intent. This isn't just a technical upgrade - it's changing what "relevant content" means at the most basic level.
The strategic context for SEO professionals: Google's recent updates increasingly favor content that demonstrates topical expertise and semantic depth over content optimized for specific keyword phrases. This shift means SEO professionals who understand semantic relationships will have a competitive advantage in creating content strategies that align with search engine evolution.
Emerging algorithmic developments that will impact your workflow:
Transformer-based similarity measures: Next-generation algorithms that understand context and sequence, not just word relationships. These will better evaluate how well your content flows logically and answers user questions comprehensively.
Multimodal embeddings for images and text: Future SEO tools will analyze how your images, videos, and text work together semantically. Alt text optimization will evolve into comprehensive visual-semantic alignment strategies.
Domain-specific embedding models: Instead of general-purpose embeddings, we'll see models trained specifically for e-commerce, B2B SaaS, local business, and other SEO contexts, providing more accurate similarity analysis for specialized content types.
How this evolution impacts daily SEO practice:
Content planning shifts from keyword-centric to topic-cluster-centric approaches
Competitive analysis evolves to compare semantic authority rather than just keyword rankings
Internal linking becomes semantically-driven rather than manually curated
Content audits identify semantic gaps and opportunities that traditional analysis misses
Conclusion and recommendations
Bottom line: Cosine similarity's dominance in SEO tools is justified by solid performance, but understanding alternatives helps optimize specific use cases and build confidence in your analysis.
Think of choosing similarity algorithms like selecting the right lens for a camera. Most photos look great with the standard lens (cosine similarity), but sometimes you need a macro lens to capture fine details (Manhattan distance) or a wide-angle lens to see the bigger picture (Pearson correlation). The photographer who understands when to switch lenses takes better photos than the one who only uses what came in the box.
Key takeaways with human context:
Cosine similarity remains the best general-purpose choice for SEO content analysis
The reliable workhorse: Like the standard drill bit in your toolkit, cosine similarity handles 90% of SEO content analysis tasks effectively. Our testing confirmed it performs well across diverse content types and provides intuitive similarity scores that most SEO teams can interpret confidently.
The performance gap is significant enough to justify continued use as the default
Don't fix what isn't broken: While Manhattan distance showed superior separation in our controlled test, the difference (1.081 vs 1.044) isn't dramatic enough to justify abandoning proven workflows. Cosine similarity's track record and widespread tool support make it the sensible default choice.
Alternative algorithms have niche applications worth exploring
The specialized tools matter: Just as you wouldn't use a hammer for every job, certain content analysis scenarios benefit from specialized algorithms. Technical content audits might benefit from Manhattan distance's sensitivity to subtle differences, while content series planning might leverage Pearson correlation's pattern detection.
Understanding your algorithm choice builds confidence in semantic analysis results
Knowledge reduces anxiety: When Screaming Frog flags potential duplicate content, you'll interpret the results more confidently if you understand why cosine similarity made that determination. This understanding helps you trust the tool's recommendations and explain findings to clients or stakeholders.
Action items for SEO professionals with practical guidance:
Continue using cosine similarity as your primary algorithm
Practical step: Don't change your current Screaming Frog or similar tool configurations. The default settings exist for good reasons, and our testing supports their continued use for general SEO content analysis.
Experiment with our testing methodology on your specific content
Weekend project approach: Download our Python code and test it on a sample of your own website's content. Look for cases where alternative algorithms identify relationships or differences that cosine similarity missed. Document any insights that could inform your content strategy.
Build internal knowledge around similarity analysis confidence levels
Team education goal: Schedule a training session to help your team understand what similarity scores actually mean. When someone sees a 0.85 cosine similarity score, they should understand whether that indicates strong duplication risk or moderate topical overlap.
Consider custom testing when working with specialized content types
Strategic decision point: If your site focuses on highly technical content, multilingual markets, or unique content formats, the performance differences between algorithms might be more pronounced than in our general testing. Budget time for custom analysis when standard approaches feel inadequate.

Mikael Araújo is an international SEO consultant, and data scientist from the University of São Paulo (USP/ICMC). He combines technical SEO and content strategy in organic search optimization, using data science to drive measurable growth. He also loves trail running.
Related Articles
 The Role of Informational Content in the Age of LLMs


 How to Develop an SEO Strategy: What Does the Data Say?

 How to Stay Relevant in a World of AI Overviews & Query-Fans

 Sitebulb Desktop
Find, fix and communicate technical issues with easy visuals, in-depth insights, & prioritized recommendations across 300+ SEO issues.
- Ideal for SEO professionals, consultants & marketing agencies.
 Sitebulb Cloud
Get all the capability of Sitebulb Desktop, accessible via your web browser. Crawl at scale without project, crawl credit, or machine limits.
- Perfect for collaboration, remote teams & extreme scale.