Become the hero in any migration story with our Website Migrations Training Series!
Website Migrations Training
Register now


Sitebulb Version 5
Version 5 was developed through 2022 while we were also focused on Sitebulb Server, and contains a number of server-specific elements.
Version 4 was developed mostly during 2020 following on from Version 1, Version 2, Version 3 and the beta years.
Version 5.149
Released on 23rd November 2022
Updates
#1 Added a 'Seed URL List' for inclusion paths
On bigger or more complicated websites you may find yourself wanting to crawl specific sub-sets of URLs on the website. Sitebulb offers a range of URL exclusion options in the audit setup area:
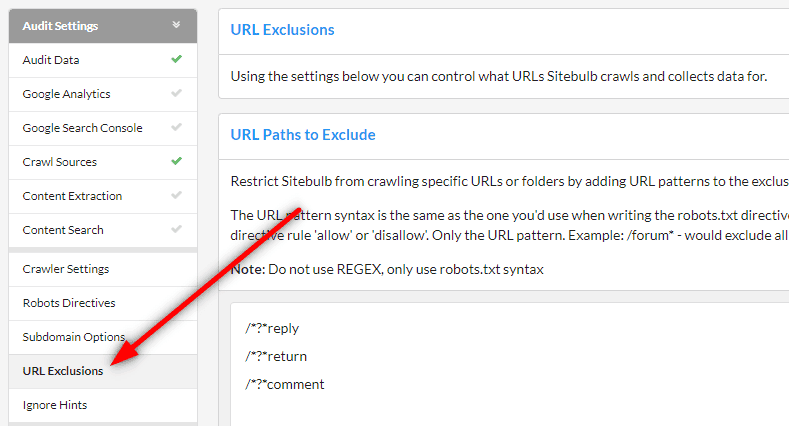
One of the exclusion options is 'URL Paths to Include,' which is a confusing and counter-intuitive name (tbh I think we originally 'borrowed' the nomenclature from DeepCrawl, back when they used to be called DeepCrawl).
Even though we say 'include,' it is actually a specific type of 'exclude,' as it restricts Sitebulb to crawling only the URL paths listed - all other URLs are excluded.
Cool, cool. Now we understand what the fucking name means at least.
So an example may be, only crawl URLs in these folders:
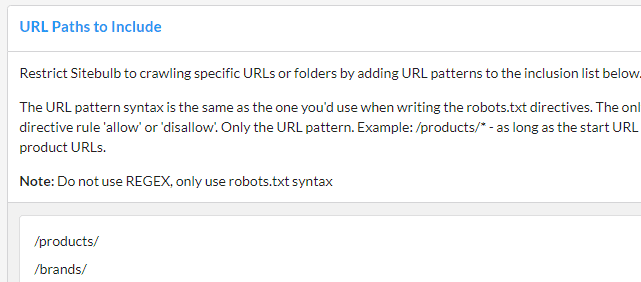
BUT there's a (potential) problem with this. What if the Start URL you use links to /products/ but not to /brands/? And what if the /products/ pages also do not link to /brands/ URLs? This means that Sitebulb will never find any URLs of that form, and therefore will not be able to crawl them.
Despite the long-winded and unnecessarily verbose nature of our undertaking thus far, we now appreciate both what the poorly-named feature does and said feature's limitations, and finally, we come at last to the elegant solution, a URL Seed List;
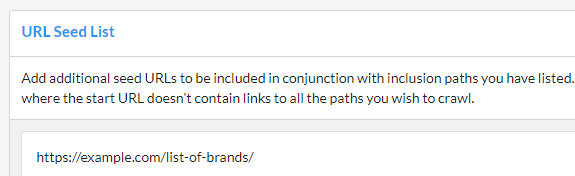
For any URLs included in the seed list, Sitebulb will also parse the HTML on these pages and extract links - in addition to the Start URL and any other pages crawled.
This means you can 'force' Sitebulb to find links to your included URLs, and live happily ever after.
Shoutout to the awesome Rachel Anderson who told us, 'Hey y'all I want multiple start URLs' - you have her to thank for this change.
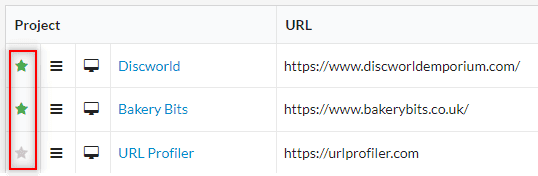
#2 You can now 'favourite' projects
Some users (such as myself) have hundreds of projects in their list, so picking out specific ones to analyse can be time consuming and, quite frankly, annoying. We have now added a 'favourite' button on the far left of the project screen - once you toggle this, the project will immediately jump to the top of the list (Latest Audit Date counts as the secondary sort when you have multiple favourite projects).
And no, Americans, before you start, it is definitely not 'favorite.'
Fixes
- In version 5.148 we updated an element of the UI, which inadvertently broke a variety of different views within Sitebulb, probably the most notable of which being 'Print PDF Reports,' which a bunch of people messaged us about. Sorry about the hiccough (hiccup?).
- When viewing accessibility violations, the rendered HTML was displaying encoded, meaning that our regex highlighter was not working at all and not highlighting the issues.
- We tweaked the way in which international (i.e. hreflang) checks work in conjunction with noindex directives, and in particular how they work with the robots setting 'Don't Report Noindex' when crawling staging sites. This one isn't strictly a bug per se - because the software was doing what we wanted it to do - but we realised that what we wanted it to do was probably wrong!
Version 5.148
Released on 11th November 2022
Updates
#1 Added audit notes functionality
Now you can add a note to an existing audit, via a new panel on the Audit Overview page.
This will allow you to communicate with future versions of yourself;
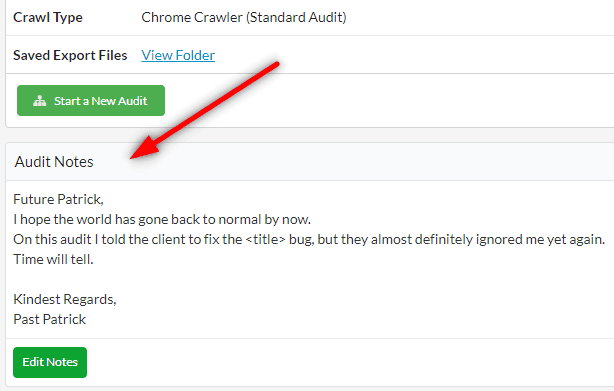
Aside: if useful/boring notes are more your thing, this is also acceptable.
You will also see any saved notes present on the audit list on the project page, delineated by this little green icon:
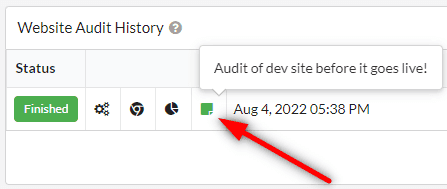
(if this icon is red, it means no note has been saved against the audit).
#2 Fix broken HTML (in the background)
In the last few weeks we have encountered websites which have HTML that is so fundamentally fucked it feels like it was designed specifically to hurt poor defenseless crawlers like Sitebulb.
In order for Sitebulb to extract data from a web page, it needs to parse the HTML (like Google does).
When the HTML is as screwed up as the Targaryen gene pool, Sitebulb can't parse the HTML, which means it was basically not able to crawl the site at all.
So now, when we encounter this sort of shit and bollocks, Sitebulb will fix the HTML first, and then parse it.
Stop making crappy websites.
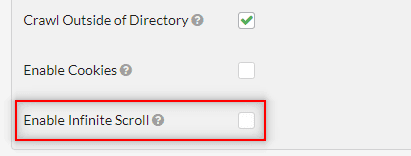
#3 Added infinite scroll (optional)
Sitebulb now supports infinite scroll, as an option you can turn on for the Chrome Crawler. Once enabled, Chrome will use a 10,000 pixel viewport height along with a scroll-and-wait technique to make sure the browser has seen all the content.
This means that Sitebulb can now access and report on images and content that loads on a scroll event, which is ideal if, for instance, you want to check all the images on a site that implements lazy loading.
You can switch it on via a checkbox in the Crawling Settings:
Shoutout to Rick from Totally Digital for pointing out that Sitebulb was not finding tons of client-side JavaScript that was being loaded in halfway down the page. For some reason he was not fully satisfied with our initial response, 'why don't you just stop using client-side JavaScript...?'
Please note that the infinite scroll will not work alongside either the Performance or Accessibility options. This is because performance testing is done based on the observable visible area, and increasing the visible area totally defeats the object!
Fixes
- The Single Page Analysis tool was not showing any URLs at all for links found on the page. It was just a big embarrassing table of nothing, like a list of things the Tory government have done in the last decade that have had even a tangential benefit to the British public.
- Occasionally, you may find that your internet connection drops out while you are using Sitebulb - like when your mum would pick up the phone to call her sister and you'd get booted off ICQ. If this happens while you are crawling, Sitebulb is supposed to pick up crawling where it left off - but it wasn't. Now, we're saving off a 'connection interrupted' date/time, and as soon as the internet connection is restored, we will resume any interrupted audits (from the last 24 hours).
- The 'click to add files' functionality had stopped working for URL Lists and XML Sitemaps. The drag-and-drop functionality still worked, so it was fine for most users, but this was not working on people running Sitebulb on a VPN (or for people that do not know how to use a mouse).
- Sitebulb was failing to crawl a staging site because it did not have a robots.txt file, as apparently Sitebulb was expecting to see one, and would basically just give up if it didn't find one (no, I don't know why Gareth built it like that either).
- Updated the 'Ignore' rules to include some additional Hints which were not there before. They weren't new Hints or anything, we'd just accidentally ignored them previously. Sorry. I'll get my coat.
Version 5.147.1
Released on 3rd October 2022 (hotfix)
Fixes
- Resolved an issue introduced in the previous release which meant Sitebulb would only crawl 1 URL if you happened to tick 'Don't crawl parametrized URLs'(!). One of these type of errors;
Me: So... how did this bug manage to get... introduced?
Gareth: Who was it that didn't fucking test properly??
Version 5.147.0
Released on 20th September 2022
Before you ask, yes, version number .147.0 is indeed correct, and yes we know it's ridiculous. You see, we've had folks testing out the Sitebulb Server beta for the last couple months, and they were on some crazy version number like 5.99.40 or something - and we needed this number to be higher (147 > 99).
So...147 (to mark 147 days since we last did an official public release. And you lot are always moaning that we update the software too often!)
Updates
#1 Upgraded Accessibility audit
We've had an Accessibility audit in Sitebulb since version 2.0 back in 2018, and we pretty much haven't changed it since then - so today's update marks a pretty large (and overdue!) improvement.
The Accessibility checks are run using Deque's open source testing library, axe-core, and we have upgraded that to the latest version - adding over 50 new checks in the process.
You can still only run Accessibility using the Chrome Crawler, but you will notice that we have removed the warning about it taking a long time to run - this is because the new version of axe-core is MUCH faster :)
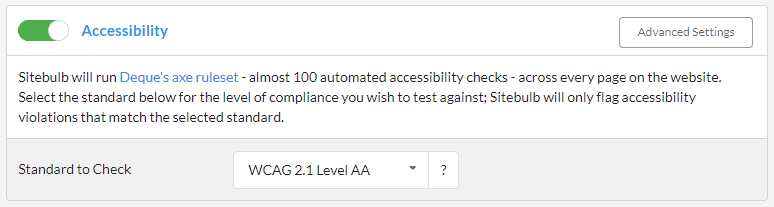
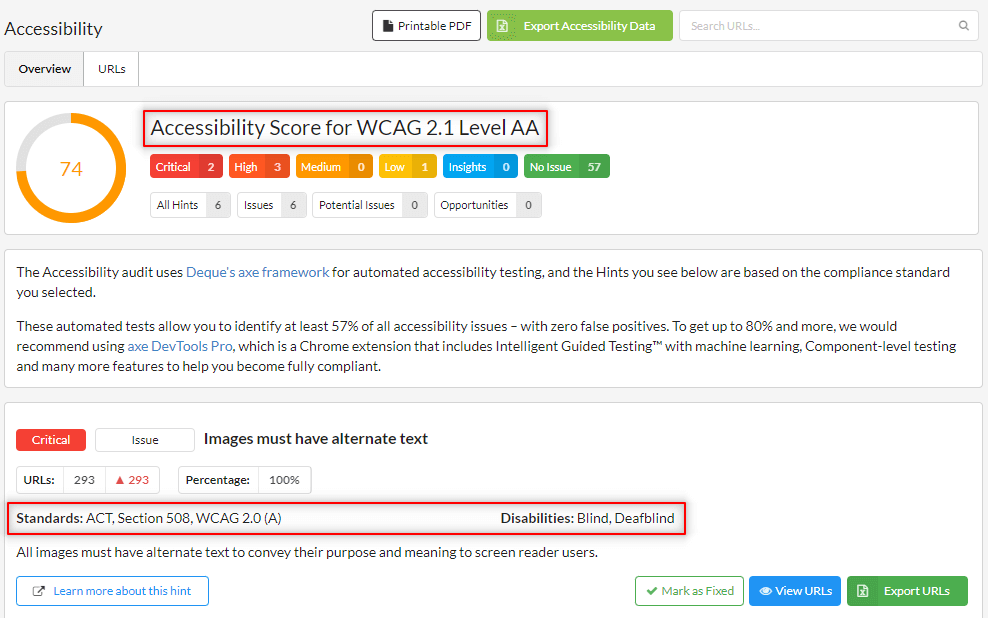
You may also notice that we have added a new dropdown option to configure the accessibility standard you wish to check against (WCAG 2.1 Level AA being the default).
Once you run an audit with Accessibility on, you'll see how the selected standard affects what Hints you are shown. Hints for the other standards will not be checked/shown, so the score is based only on the selected standard.
Additionally, for each Hint, we are also now including the standard it applies for and the disabilities it aims to assist.
Over the next few weeks we'll be working more closely with Deque to shine a light on web accessibility to the SEO community, so keep an eye out for the content we've got coming your way.
#2 Updated Chrome to the latest version
I know, no one gives a fuck about this, but we still did it.
Sitebulb's Chrome Crawler is now using Chrome version 105 (ok... 105.0.5173.0).
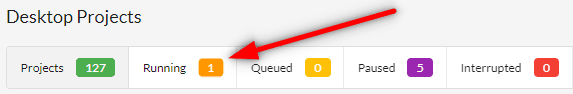
#3 Added 'Running' tab
We've added a new running tab, so you can see when audits are running in the background. We show the number of audits running because on Sitebulb Server, you can run multiple audits simultaneously...
#4 Integrated elements to make Sitebulb Server work
As I alluded to above, this version needs to be compatible with the Sitebulb Server beta (which is still running), so there are certain elements which may seem new or unusual. Rest assured that if you are not getting involved with Sitebulb Server, these changes won't affect your normal day-to-day running of the software.
The first thing to note is that 'Projects' is now named 'Desktop Projects', as in, 'the projects that have been run on this desktop computer.'
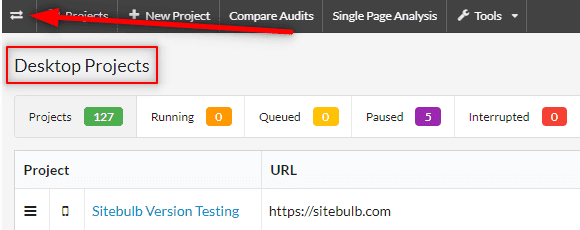
Clicking that little switcher button in the top left reveals a dropdown that allows you to switch between Desktop and Server.
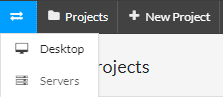
This is your last chance. After this, there is no turning back. You click the Desktop button - the story ends, you wake up in your bed and believe whatever you want to believe. You click the Servers button - you stay in Wonderland and I show you how deep the rabbit-hole goes.
Unfortunately, no one can be told what Sitebulb Server is. You have to see it for yourself.
Fixes
- The 'All Hints' upload to Google Sheets would not use the correct file name. Well this is not strictly true - it's not as if it would passive aggressively change the file name to poke fun at your inability to only ever have one chocolate biscuit - it would simply use the 'All Hints' filename no matter what you actually entered.
- Sitebulb was returning a 200 status on HTTP URLs, and ignoring a HTTP -> HTTPS redirect. The reason only 1 person noticed this is because it was only doing it on sites that don't have a robots.txt file.
- The other day Barry emailed me with a screenshot showing a recent encounter with a rogue instance of 'Indexation' we had evidently missed (in the add/remove columns listing). Suffice it to say he was not pleased with this discovery...
- If you did 're-audit failed URLs' while using the Chrome Crawler, Sitebulb would finish off the audit by listing out all the technologies it found on the website. A process it had already done when you audited the website first time around! The result would be an unmistakably ridiculous list of entirely duplicate technologies.
- Resolved issues with the HTML content area selectors not working correctly on certain websites.
- Issue where Sitebulb would not collect a fresh version of the robots.txt file, when re-auditing the website. This is all well and good...until the developers finally pull their finger out and actually implement those changes you sent them 6 months ago - in which case the robots.txt changes were not being reflected in the new audit.
- Sitebulb was not correctly recording 'incoming canonicals' on the URL Details page (these are canonical links that point at the page you are looking at). By the way, it wasn't a user that reported this - I noticed it myself. At least someone is fucking well paying attention.
Version 5.9.3
Released on 26th April 2022
IMPORTANT: Lots of users have been impacted by Bitdefender blocking Sitebulb. If this is you, please don't skip the solution below!
Updates
#1 Stopped Bitdefender blocking Sitebulb
Anti-virus software is wonderfully brave and strong. It defends your honour and defeats the bad guys for you, keeping you safe and warm in its embrace.
But it doesn't give a shit about that client report you needed to get done yesterday. If some two-bit desktop software looks askance at your anti-virus, it'll whip it into chains quicker than you can say 'Chuck Rhodes.'
This is what Bitdefender has been doing to numerous Sitebulb customers across the globe, blocking elements of Sitebulb and flagging them as 'infected':
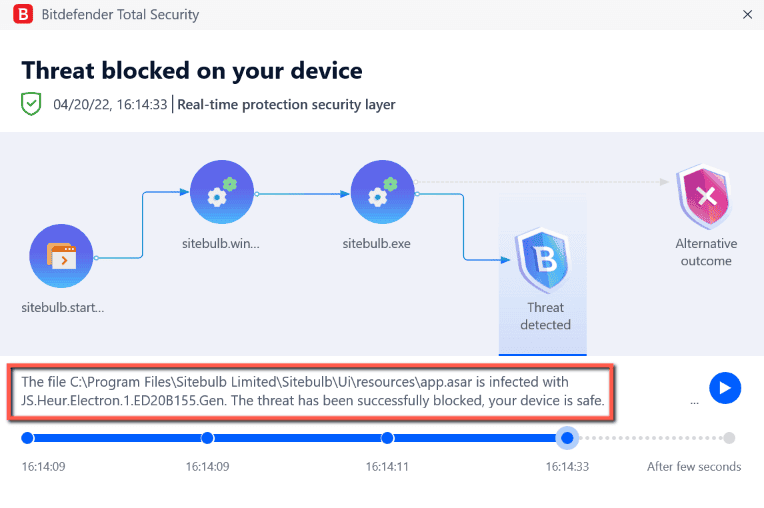
'Your device is safe.' Thank fuck you're here, Bitdefender.
The apparent virus that Sitebulb was infected with is called: 'JS.Heur.Electron.ED20B155.Gen'
The 'Heur' bit of this stands for 'Heuristic', and 'heuristic analysis', according to Norton, is '...an adaptive antivirus defense that discovers malicious code through educated guesses.'
Brilliant, so Bitdefender is just guessing.
Oh and the 'Gen' bit on the end, that stands for 'Generic'. It's the anti-virus equivalent of a smell test.
As it turns out, there is a reason that Bitfender starting flagging Sitebulb all of a sudden (when we had not changed anything) - because Electron has recently been used to distribute malware. Electron is a popular framework used by desktop apps - for example both Slack and Spotify use it. Sitebulb uses it to deliver the user interface... so it's kinda important.
Bitdefender has spotted an 'Electron pattern' similar to the malware, and has thrown the kitchen sink out with the baby.
Thanks to Bitdefender's stoic bravery, you can't use Sitebulb anymore. High five emoji!
Anyway, I'm not mad about it, but we have altered Sitebulb so that Bitdefender no longer shits its pants.
Frustratingly, you need to go through a few steps of uninstalling before reinstalling, so I have written up a guide detailing all the ins and outs.
I'm not even mad about it.
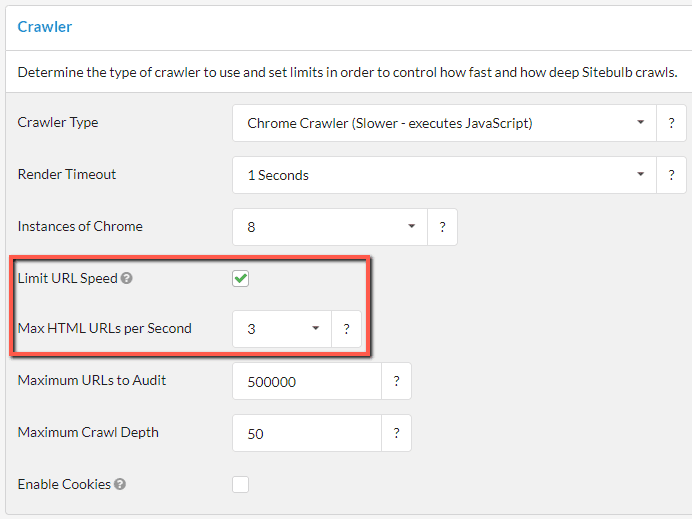
#2 Control URLs/second for Chrome Crawler
Up to now the only way to control crawl speed when using the Chrome Crawler has been to limit the instances of Chrome. Now, you can also limit the number of HTML URLs per second crawled, much like you can with the HTML Crawler.
Some said it couldn't be done, but we made it happen. And by that I mean Gareth - Gareth said it couldn't be done.
And actually what happened is that someone pointed out (to Gareth) that a competitor was doing exactly this and why could we not do it too and lo and behold all of a sudden it was done.
#3 Single Page Analyser now reports 4XX and 5XX errors
You get back some screenshots and HTTP headers. Quite delightful:
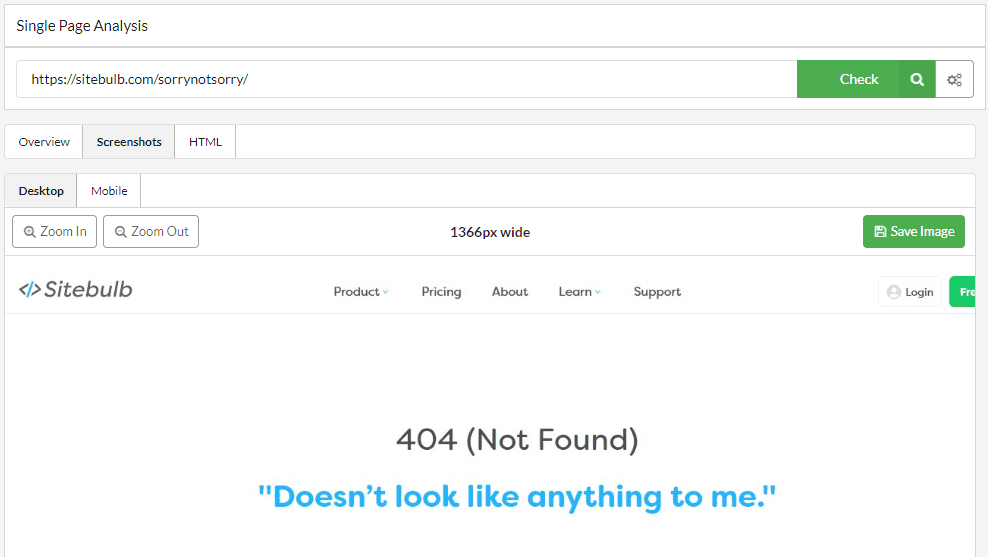
Excuse me?
What do you mean, ' that's barely useful'??
Don't get me wrong, I agree. It's a marginal 'update' at best, but I'm taking what I can get when you see how much of this update is devoted to bugs (scroll down), however I take umbrage at your entitled, and quite frankly ungrateful, tone.
Fixes
- Lots of Squarespace sites very sensibly insert a <div> above the <head>, WHICH IS NOT VALID HTML YOU TWATS. This was breaking Sitebulb's HTML parser so it could not record things like canonicals correctly. Since browsers have now adapted to ignore all of this stupid shitty HTML, we have followed suit and developed a range of 'stupid broken HTML shit that we will now just ignore'.
- Fixed the formatting for the 'Example URL' hover state in Spelling suggestions.
- Searching 'All Hints' would not show any results when you searched for DOM elements like <h1> in <angle brackets>.
- Sitebulb was not recording the expiration date on lazy-loaded resources, which meant they were inaccurately flagging the Hint 'Serve static assets with an efficient cache policy.'
- The schema entity report was showing an inconsistency when entities were found that did not implement an @id node identifier.
- When you ran 're-audit failed URLs' and had Spelling suggestions ticked, Sitebulb would insert all the spelling errors into the database for a second time!
- The spell checker was also still flagging some sites for capitalisation issues when none were present (specifically this time on spelling 'errors' found in the meta description).
- The spell checker was also trying to spell check emojis, and crashing Sitebulb when it encountered them!
Version 5.9.2
Released on 29th March 2022 (hotfix)
Updates
- Added an 'open URL in browser' option when looking at example URLs in the list of Spelling errors, thereby slightly improving your 'Fixing Spelling Mistakes' workflow.
Fixes
We get a handful of support tickets each day where users ask questions or report bugs. Most users just find the issue, send the email, then carry on about their day. Most users don't make a big song and dance about it - there's no need - they're just sending a simple email.
Unfortunately, @TheHodge does not fall under the category of 'most users'...

Is it desperate and attention seeking? I'll let you be the judge of that.
But yes, technically, it could be argued that Dom did indeed identify and report a tiny and inconsequential bug. He'd built a website that used a rather unusual CSS versioning methodology, which was causing Sitebulb a headache. Fortunately for Dom, we have now improved Sitebulb so that it works perfectly in spite of his appalling website.
To be truthful, however - and having seen the website - this should be the least of his worries...
Onto the less attention-seeking bug fixes:
- Issue with the Google Sheets 'All Hints' export, which for some users was hitting an annoying API error. When we looked at the logs we saw that the returned error from Sheets was 'You can't freeze all visible columns on the sheet.'
Well of course you can't freeze all the bloody columns on the sheet, Sitebulb, why the fuck were you trying to do that in the first place?? - We added some cool settings back in v5.8 that allowed users to define their own content areas using CSS selectors (Content, Header, Footer, Navigation, etc...). Many pundits described said feature as 'delightful'. Except...we sorta realised that perhaps the 'Content' selector wasn't actually being saved into the project settings like it should have been, which meant that one didn't work at all. A shade under 'delightful', perhaps?
- A site had some JavaScript links that would show up as 404s if you tried to crawl the site with the HTML Crawler - the links would end up like https://example.com/page{{link}}. However Sitebulb was recording the 404s but displaying the URLs without the {{link}} bit, so they just looked like totally normal URLs which should have returned a 200 status. Which of course they were not.
- Made a couple of adjustments to the spellings feature - fixed up some dark mode UI bugs, and stopped Sitebulb from incorrectly flagging errors based on capitalisation.
- Fixed an annoyance with the URL Details page, when viewing the performance data, where the resource tables would overlap the max width of the window (when you made the window reeeeeeeeeally small). If this happens again in the future, our recommendation will be to buy a bigger screen.
Version 5.9.1
Released on 14th March 2022 (hotfix)
Fixes
- The 'audit running' notification was not showing correctly for some users, causing them to think (justifiably!) that there was no audit running. So they'd start another one, and the new one would go in the queue (because there was actually an audit secretly running!) and so chaos ensued.
- Some other users were actually experiencing an issue where Sitebulb would not open at all, following install. It could be fixed by re-installing, but that's a pretty shit experience where you have to install a program twice in order for it to work.
Version 5.9
Released on 10th March 2022
Updates
Increased Google Sheets upload limit to 10million cells
Google have just updated the cell limit for Sheets from 5million to 10million (that's almost more than double!), so we have followed suit with our upload allowance.
Their docs now state the limits as 'Up to 10 million cells or 18,278 columns (column ZZZ) for spreadsheets that are created in or converted to Google Sheets.'
I've warned Gareth to stop building new features in case we hit the column limit, but I do not expect he will listen.
Fixes
- Sitebulb was not handling certain content extractions well - such that the UI would not show the data at all - which was utterly useless if you did indeed want to look at the data (100% of respondents answered 'yes' to this question).
Version 5.8.2
Released on 21st February 2022 (hotfix)
Fixes
- Sitebulb was reporting a Chrome error when the start URL generated a JavaScript redirect. Now it will alert you of the redirect, but allow you to crawl the site regardless.
- A small number of websites were getting stuck on the domain check.
Version 5.8
Released on 15th February 2022
Where our last update was basically just new stuff and no bug fixes, this one is sort of the opposite. A number of users had reported issues where Sitebulb would simply refuse to crawl certain websites with the Chrome Crawler, so we had to get a fix out sharpish.
Updates
#1 Updated Chrome Crawler
Updated the Chrome Crawler to the latest stable version of Chromium (v99), per our commitment to crawling just like Google. At the same time, we resolved all the Chrome crawling issues that had blighted our previous release.
#2 Sitebulb can now crawl Shopify sites 5X faster
For years, Shopify sites would push back on unruly crawlers like Sitebulb if you tried to crawl any faster than 1 URL/second, spitting back a disgusted 429 response (which is server speak for 'piss off'). It appears that this limitation is no longer present, so we've changed our advice, now suggesting you crawl Shopify sites at a maximum of 5 URLs/second.
Of course, SEOs (being SEOs) will now use this as a carte blanche and will ramp the speed up to 400 URLs/second, before moaning on the socialz when they get immediately booted off the site.
It is written.
#3 Split 'similar content' into an on/off option
Similar Content is one of a battery of 'duplicate content' checks that Sitebulb can do. On the vast majority of sites, it works great. However, when you are crawling sites in the tens or hundreds of thousands of URLs, it can be pretty resource-intensive. CPU and RAM can climb dramatically, which does not make for a pleasant crawling experience.
So, we've changed the setup to make similar content an option that can be switched on and off, and is off by default.
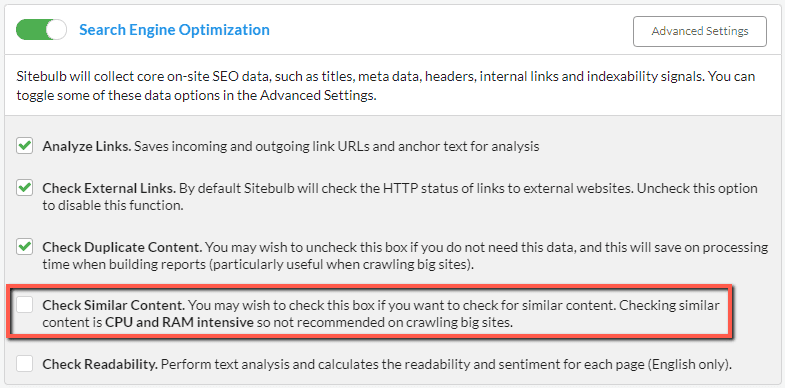
It will remain ticked 'on' for re-audits where it was checked previously, but when you start new projects this will need to be something you proactively turn on, if you want the data.
This is, of course, the sort of thing that no one will remember, so I am already looking forward to the support tickets in a couple of weeks time... 'Why the f$%k is similar content not working?!???'
#4 Added two new content areas
For years, Sitebulb has led the way in terms of automatic content area selection, including the automatic classification of internal links based on their location on the page.
We have taken that a step further today, adding two new locations: 'Breadcrumb' & 'Aside.' These are most easily accessible via the Links report, which shows the breakdown for each link type found on the site:
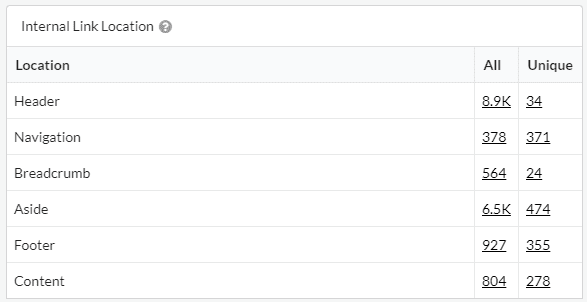
If anyone is unfamiliar with this table, it is worth spending a bit of time exploring it further. The 'Unique' links, in combination with the link location, make for a powerful combo.
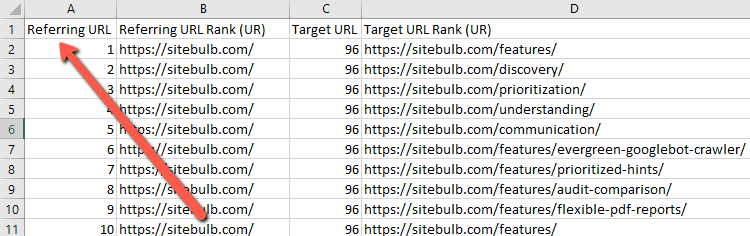
For example, look at the top row, this shows that we have almost 9,000 internal links that live in the header. However, there are only 34 unique links, since every page on our site uses the same 'header' template.
We can click on the '34' to see these header links in the Link Explorer. Since we are only looking at unique links in this case, the list will only show one example link in the 'referring URL' column:
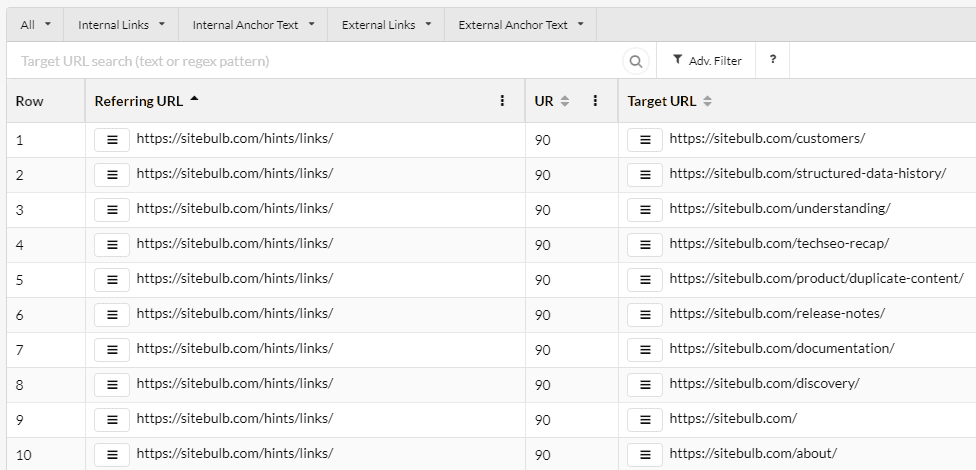
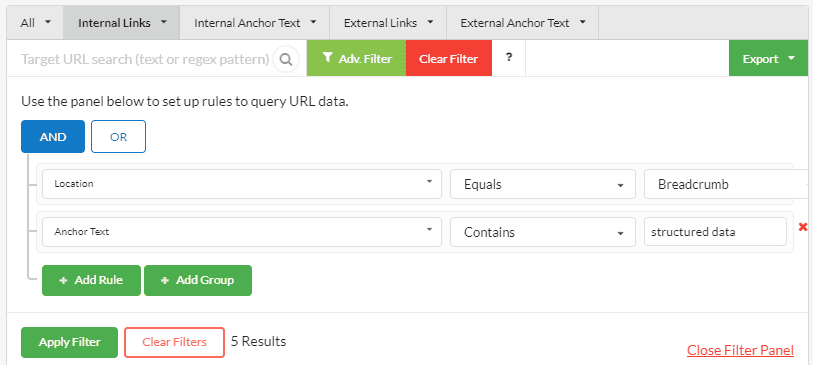
All this data is accessible and query-able in the Link Explorer directly (i.e. you do not need to start in the Links report), so you can easily build your own advanced filters for some really powerful link analysis:
#5 Configurable content area settings
Sitebulb is really good at detecting these different on-page content areas, and correcting assigning internal links into their various buckets. However, you can never underestimate cocky developers and their ability to completely fuck things up.
As such, you may find that Sitebulb cannot always perfectly identify the right areas, and may misclassify link locations or inaccurately define the content area. If this does happen, you can manually over-ride Sitebulb's automatic detection for any of the locations via a new configuration option: 'HTML Area Settings.'
This lives within the Advanced Settings under the Search Engine Optimization audit options:
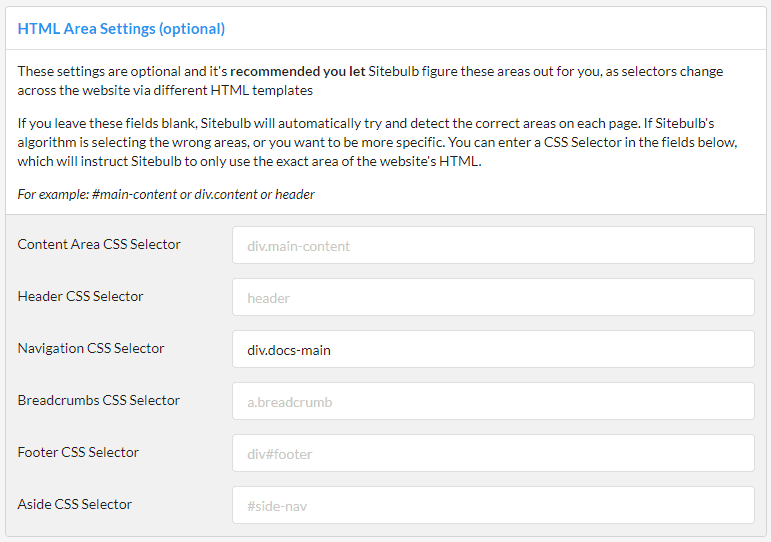
Simply add in CSS Selectors to classify any areas that Sitebulb is getting wrong.
NOTE #1: You can only add in 1 selector for each area. So if you have a site with tons of different HTML templates that all use different divs for what is essentially the same thing, Sitebulb will not be able to save you, and you'll have to go begging to the devs to get their shit together.
NOTE #2: This is entirely optional. And in most cases, entirely unnecessary. Just trust Sitebulb completely, it'll be fine...
Fixes
- Aforementioned 'site won't crawl with Chrome' issues resolved.
- Some of the new 'URL Reports' dropdowns we added in v5.6 were not matching up the numbers in brackets (e.g. (156)) to the number of URLs actually shown in the URL List when you clicked through (e.g. 152).
- Improved an issue with mismatched hreflang.
- Sitebulb was not correctly obeying an obscure robots.txt rule, that was basically redundant anyway. But we fixed it, nonetheless.
- On very large audits (e.g. 500,000 URLs), the 'audit progress' screen could freeze, even though Sitebulb was still working away in the background. This was just a UI issue, which we have now resolved.
Version 5.7
Released on 3rd February 2022
Google announces a brand new API on a Monday... SEO tool providers going into a frenzy to get it integrated by Tuesday.
We actually decided to take a bit more time with it, which explains why our own update is so disgustingly late. We wanted to give it a bit more of the 'Sitebulb treatment'...
NEW: URL Inspection API Integration
You can now check if URLs on your website are indexed in Google by taking advantage of the Search Console URL Inspection API, which you can connect to Sitebulb via the Google Search Console integration.
This can allow you to see high level data about whether a URL is indexed or not, along with 'reasons' why URLs are not indexed, which allows you to explore further.
For clarity, the data returned is data that Google Search Console stores about a given URL - the API will return indexing information that is currently available in the URL Inspection tool. What Sitebulb does is allow you to collect this data in bulk.
Connecting Sitebulb to the URL Inspection API
To connect Sitebulb to the URL Inspection API, add Google Search Console to your audit settings when you set up a Project, and tick the box under the Configuration options to Fetch URL data from Search Console Inspection API.
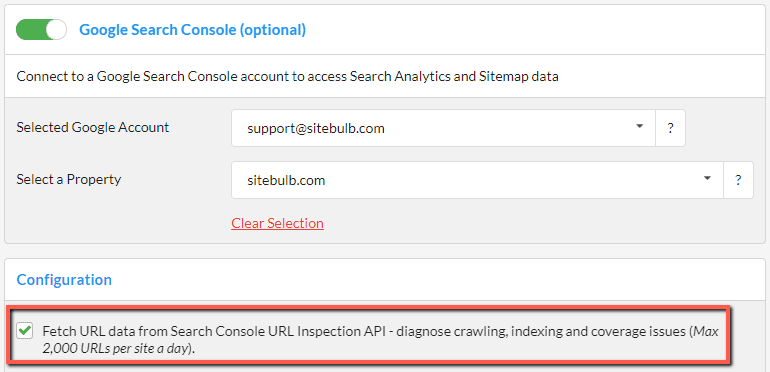
It is important at this point to make sure you select the correct property. Sitebulb will help you do this by pre-selecting the property by matching with the start URL, but you may have multiple properties for the same account (e.g. domain properties and URL-level properties).
Daily quota limit
The main caveat of this feature is that Google limit the number of queries to 2,000 URLs per day - per Search Console website property (i.e. calls querying the same site).
This means that if you have a website with more than 2,000 URLs, Sitebulb will not be able to collect indexing information about all the URLs at once. In this case, Sitebulb will query the top 2,000 HTML URLs, ordered by URL Rank.
So, by default, Sitebulb will always select the most important pages to check for indexing, based on internal link popularity.
>>>>>IMPORTANT - DON'T IGNORE <<<<<
This quota is per website, not per tool. If you collect API data via multiple different tools, they are all grabbing from the same quota pool. If you have used up the 2,000/day allowance with other tools, you will not then be able to collect more data through Sitebulb on the same day.
Similarly, there is also a query limit on the API of 600 URLs/minute. Sitebulb is set to safely query under this limit, but if you hit the API with two different tools at once, you could accidentally exceed it any hit error messages.
Viewing URL Inspection data in Sitebulb
To access the data collected by Sitebulb, navigate to the URL Inspection report via the left hand navigation.
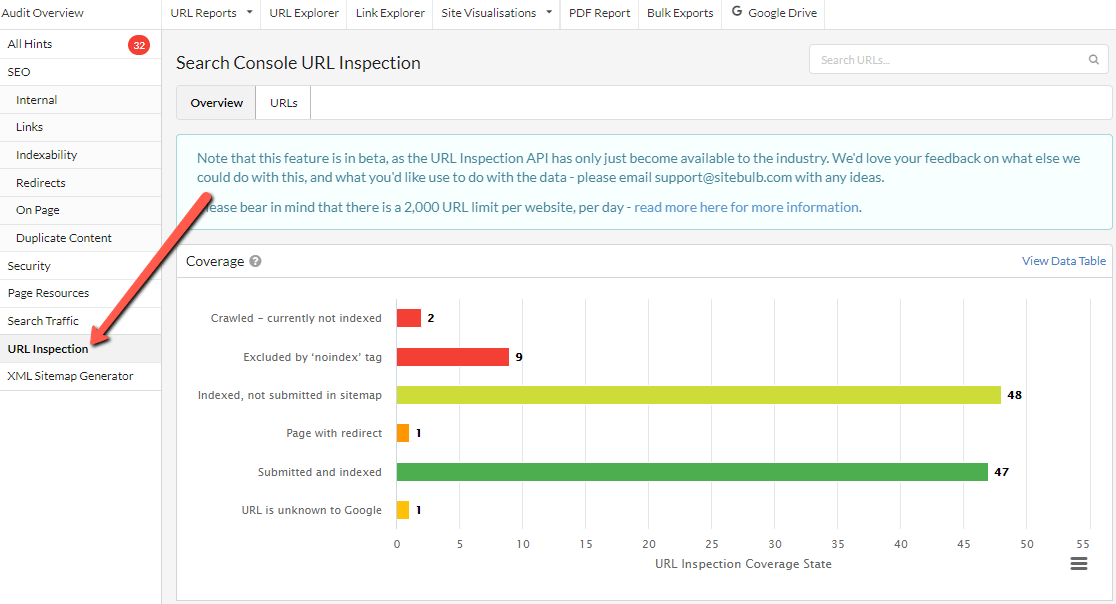
The overview shows numerous charts and tables, and if you click the URLs tab you can see all the data in table format:
As with all URL Lists in Sitebulb, the data can be augmented and fine-tuned by adding additional columns, sorting, or applying advanced filters.
Exploring URL Inspection data
The data returned by the API can be quite rich and nuanced, so to really understand what you are looking at requires some familiarity with the Index Coverage report and the URL Inspection tool in Google Search Console.
However, Sitebulb gives you easy, intuitive access to big-ticket data items like 'URLs are not indexed in Google', with a straightforward workflow for digging deeper into the data.
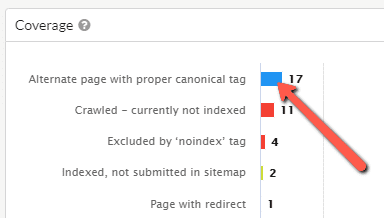
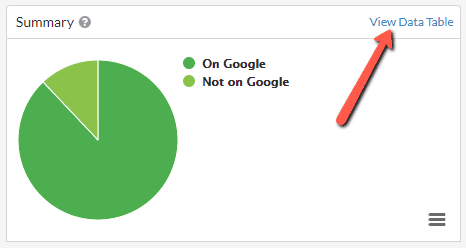
With any of the charts, click on the segment area to view a filtered URL List of the data:
This will bring you to URL data like this:
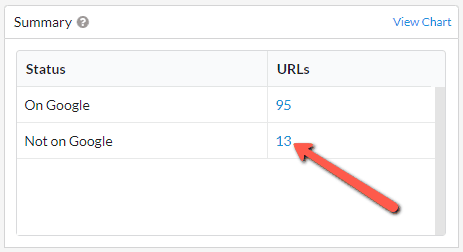
Also, on any chart, you can click the 'View Data Table' toggle, which shows the chart data in a table format:
Then the chart data will show in a table, and clicking on any of these values will also bring you to the corresponding URL List:
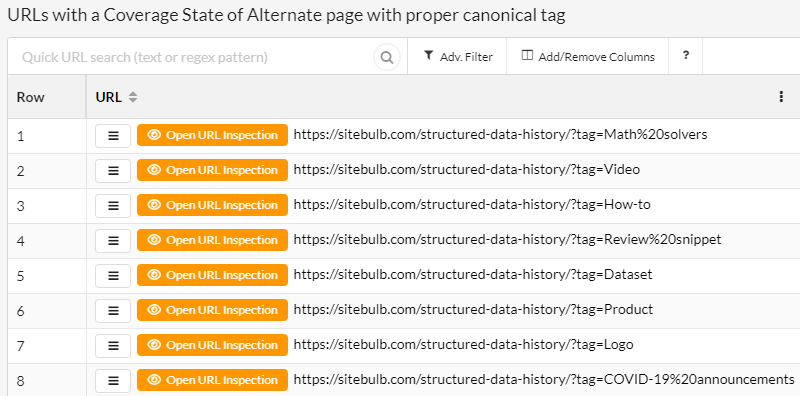
On the URL Lists themselves you can analyse issues in bulk, by scrolling right to inspect the most meaningful columns:
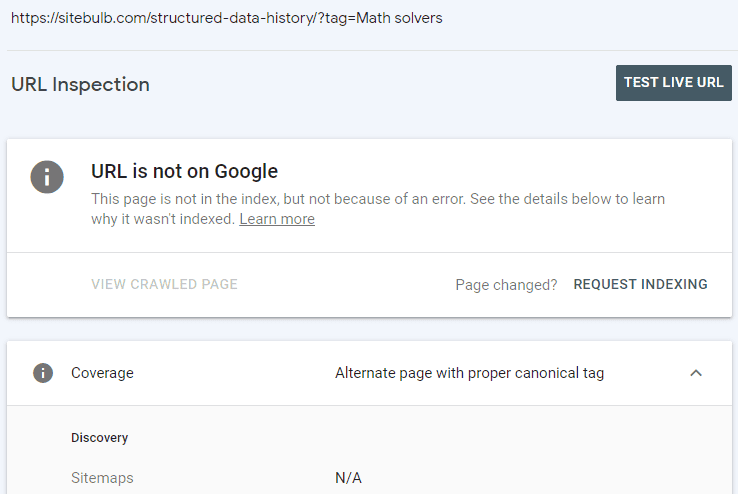
Alternatively, to dive into a specific URL and see what the inspect tool is saying in Google Search Console, just hit the orange button to Open URL Inspection:
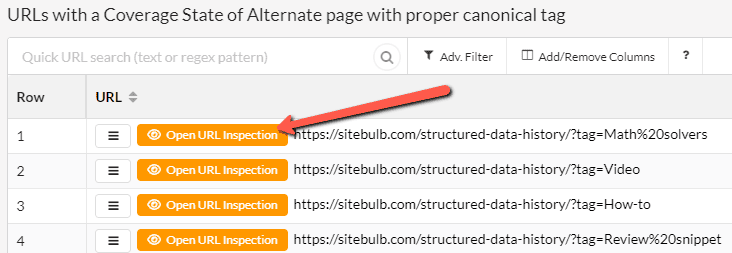
This will then open up Google Search Console in your browser, with the Inspect URL tool already open and the selected URL pre-loaded:
What the different charts show
There is a number of pie charts and bar charts on the URL Inspection report, so we will run through what each one is showing:
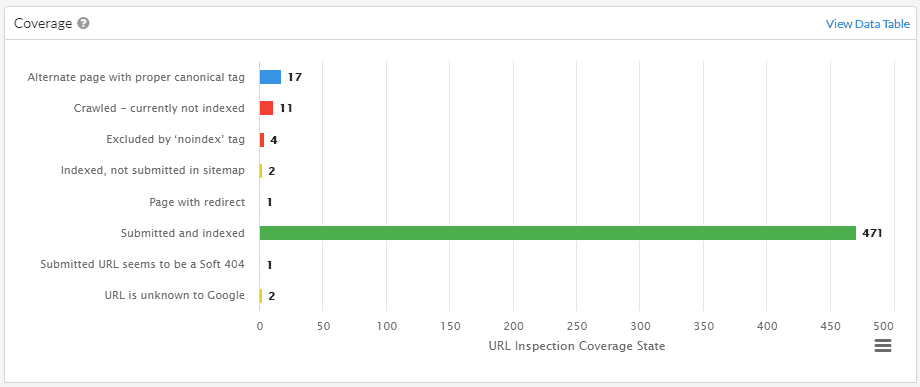
Coverage
This chart splits out every URL into different buckets, based on whether Google could find and index the page. Each option includes a short, descriptive reason for the status of the URL, explaining why the URL is or isn't on Google.
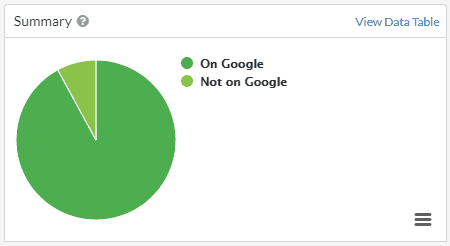
Summary
This pie chart provides a summary evaluation about whether or not URLs are eligible to appear in Google Search results.
It is important to note that 'URL is on Google' doesn't necessarily mean that the page is appearing in Search results, simply that it is indexed.
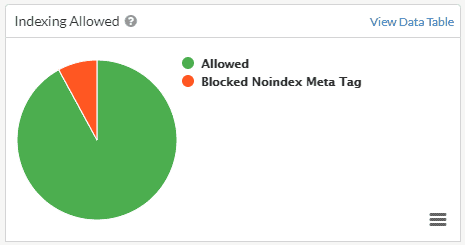
Indexing Allowed
This chart indicates whether or not URLs explicitly disallow indexing (e.g. a noindex tag). If indexing is not allowed, the reason is shown in the legend - these pages won't appear in Google Search results.
Note that if a page is blocked by robots.txt, then 'Indexing allowed' will always be 'Yes' because Google can't see and respect any noindex directives.
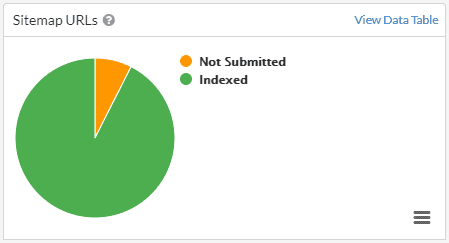
Sitemap URLs
This chart splits out the URLs submitted to the Inspection API based on their sitemap status. Either they were not found on sitemaps in Google Search Console (in which case they show as ‘Not submitted’), they were submitted and indexed, or they were submitted and not indexed.
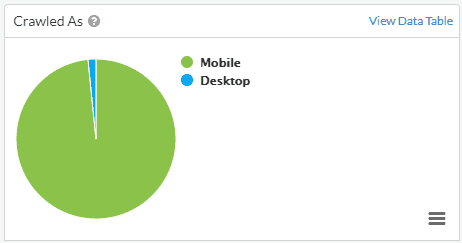
Crawled As
This chart shows the distribution between URLs crawled with Google’s Mobile Crawler vs their Desktop Crawler.
The results in this chart are only for URLs that are indexed.
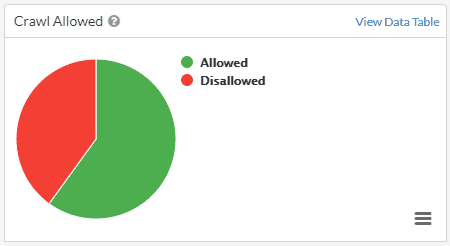
Crawl Allowed
This chart indicates whether or not URLs were allowed to be crawled by Google, as determined by the site's robots.txt rules. Note that this value is not the same as allowing indexing, which is given by the 'Indexing allowed' value.
The results in this chart are only for URLs that are indexed.
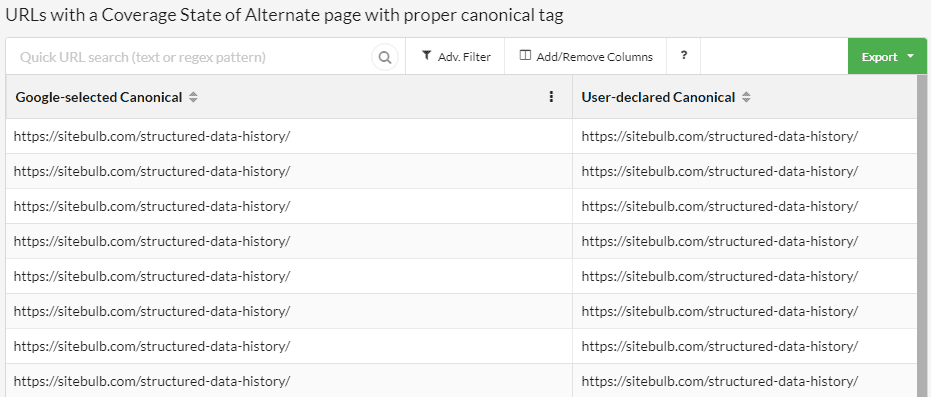
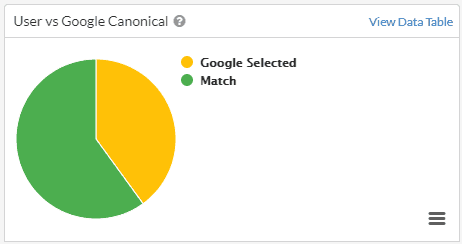
User vs Google Canonical
This chart indicates whether or not Google agree with the user-declared canonical URL. If they do agree, this will show as 'Match,' and if they do not agree, this will show as 'Mismatch.' If no canonical is present and Google have selected one, this will show as 'Google Selected.'
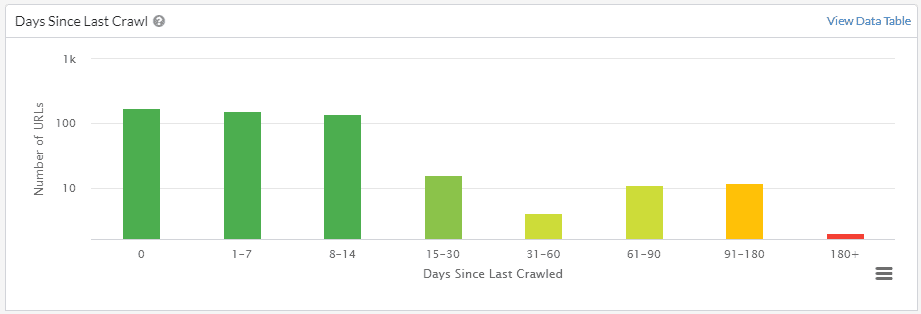
Days Since Last Crawl
This chart shows the distribution of URLs based on their last crawl date by Google. Days showing as '0' means that the URL has been crawled within the last day. The date ranges allow you to dig deeper and explore URLs that have been crawled recently – or not recently at all...
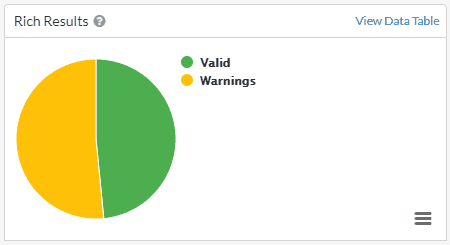
Rich Results
This chart indicates whether or not URLs are eligible for Rich Results, or if the URLs trigger errors or warnings.
The results in this chart are only for URLs that contain structured data which could lead to Rich Results.
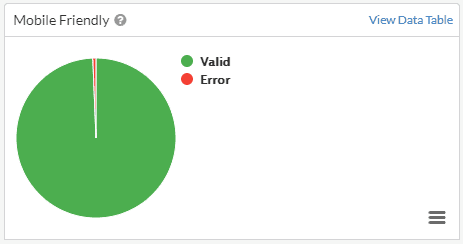
Mobile Friendly
This chart indicates whether or not URLs are deemed mobile friendly by Google, or if the URLs trigger errors or warnings.
The results in this chart are only for URLs that are indexed.
When URL data is not returned
Sometimes you will find that URL data is not returned, and this could be for a number of reasons:
#1 Quota Exceeded: You have exhausted your daily URL quota
If you go over the daily quota (see above) you will need to wait for 24 hours before trying again. Please also bear in mind that the 2,000 URL limit is per property, per day, which could mean that you've gone over the limit due to tools other than Sitebulb.
As soon as Sitebulb goes over the daily quota, it will stop sending API requests.
#2 Quota Exceeded: You have exceeded the rate limit
There is a query limit on the API of 600 URLs/minute. Sitebulb is set to safely query under this limit, but if you hit the API with two different tools at once, you could accidentally exceed it any hit errors messages.
#3 Forbidden: The URL requested is invalid for this property
This means that Sitebulb has requested indexing data for a URL that is 'not part of the property selected.'
For example, https://example.com for the URL-prefix property https://www.example.com. If you wish to check URLs from multiple subdomains, please select a domain-level property.
#4 Failed: The API has errored
This means that Google's API itself has fallen over. If this happens, come back and try again later.
That's all for today folks, enjoy!
Version 5.6.1
Released on 31st January 2022 (hotfix)
We had to do a little hotfix release because Gareth fucked something up. Again.
Updates
#1 Improved messaging on Hint Details when a page fails
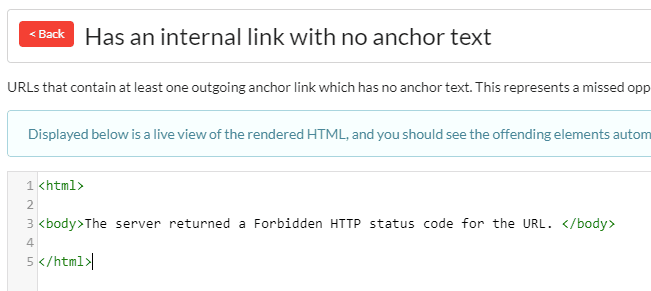
Some Hints have a URL Level option to see 'Hint Details', which (attempts) to show you the rendered HTML in real-time and highlights the issues in the code. This is a cool feature, but somewhat limited by the fact that it's not a 'snapshot' of the page when it was crawled; instead, we go off and fetch the page as it is today.
In some cases, this can prove problematic - for instance when the website/server decides it will serve 403 responses to you. Previously all we would show here is a totally blank screen, which is about as much use as those awful alcohol free 'gin alternatives' you force down your throat for the first week of the calendar year, before deciding that 'Dry January' actually means that you should only drink every other day.
So now we'll tell you when we can't access the HTML:
Fixes
#1 Stopped SPA from triggering every single bastard Hint
This is that thing that Gareth fucked up in v5.6. The Single Page Analysis tool (at the top) was triggering every single Hint for any URL you entered into it. Cue mass hysteria and panic as 2000 users noticed this issue all at once (and 2 of them actually emailed us to tell us).
Anyway we have now fixed the problem, and Gareth will personally apologise to each and every both of you.
Version 5.6
Released on 27th January 2022
Updates
#1 Added spell checker option
As you will see in the notes below, we get lots of feature requests...
Sometimes it's a thing that users REALLY REALLY need to make their workflows a bit smoother. Sometimes it's a thing that Competitor X is doing, and they REALLY REALLY want to use Sitebulb, but can't possibly live without this feature. And sometimes it's because 'John Mueller said it might be important this one time.'
Anyway, one morning in December Gareth announced that he'd decided to build a spell checker. I'd be lying if I said my eyes lit up with excitement.
But I couldn't argue with his logic - a few users had told us that a spell checker would be super useful, our competitors are absolutely already doing this, and John Mueller did at one point say that perhaps Google sometimes look at things like spelling.
However, since I have been testing the new feature I have been pleasantly surprised with how well it works. Of course this does not mean that I will publicly admit that Gareth was right, merely that his work managed to escape the normal level of criticism it attracts from me.
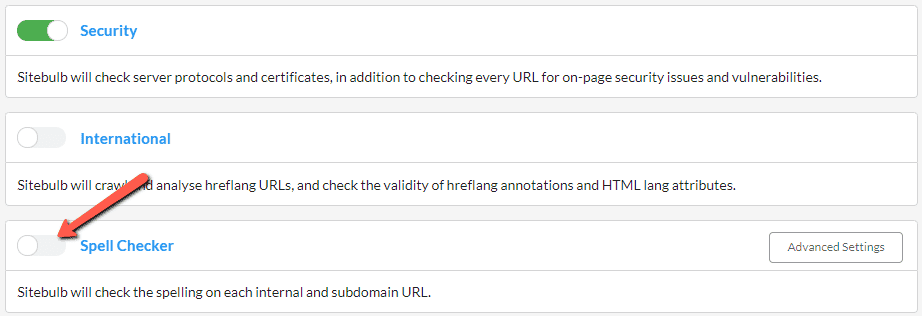
To switch on Sitebulb's Spell Checker feature, set up a new audit and scroll down the audit options, then toggle on 'Spell Checker';
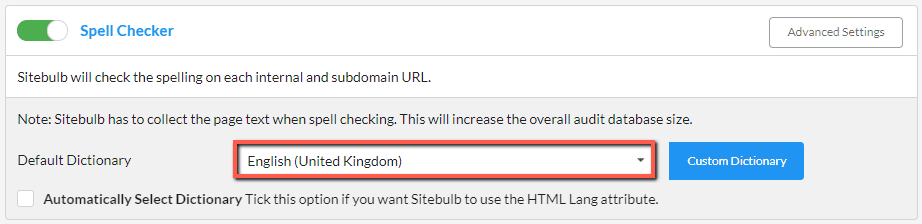
Once toggled on, then make sure to select the correct language dictionary from the dropdown:
If you are working with international websites that have multiple different languages in use, you may need/want to use this optional selection:
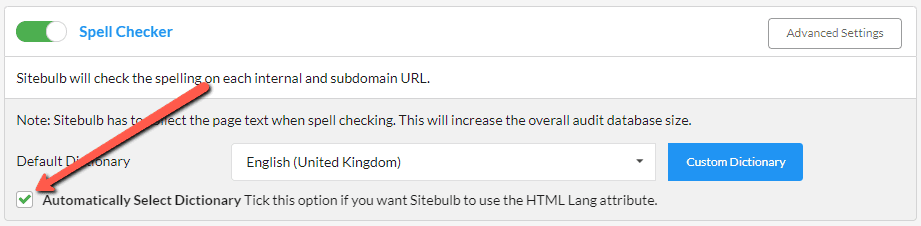
This will automatically select the dictionary to use for each page, based on the value found in the HTML Lang attribute. The default dictionary chosen will act as the fallback, in case no HTML Lang attribute is present on certain pages.
Once your audit is complete, you can view all the spelling errors that Sitebulb found by navigating to the 'Spelling Errors' report in the left hand panel:
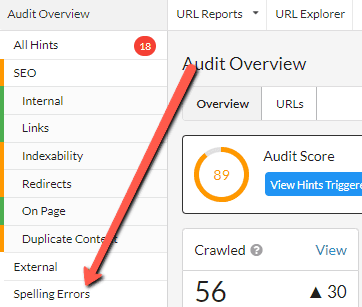
You will then be presented with a big list of all the spelling errors found, along with example URLs, quantitative data, and spelling suggestions (scroll right to get these).
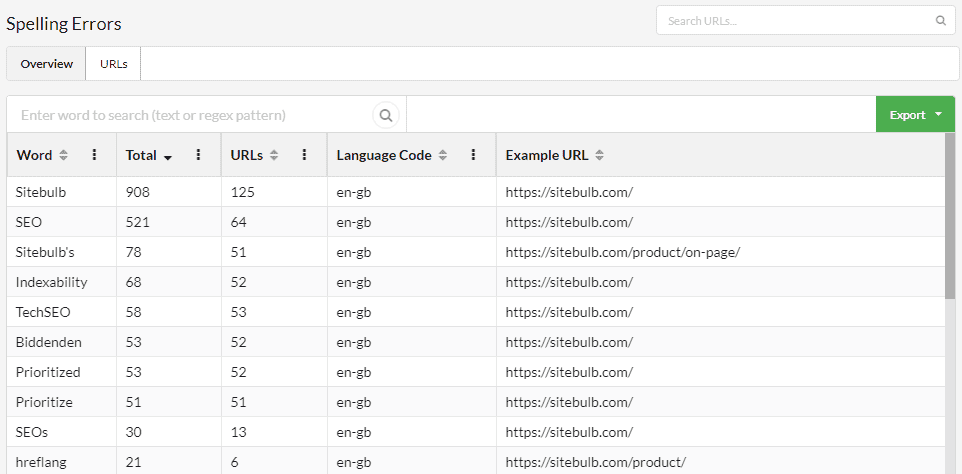
The green Export button on the right allows you to export either the spelling summary shown on screen, or ALL the spelling errors found - which includes all URL references rather than just an example URL.
As with all Sitebulb exports, you can either export to CSV or directly into Google Sheets.
To dig into spellings found on specific URLs, click the URLs tab at the top, and then hit the red Errors button to analyse a single URL;
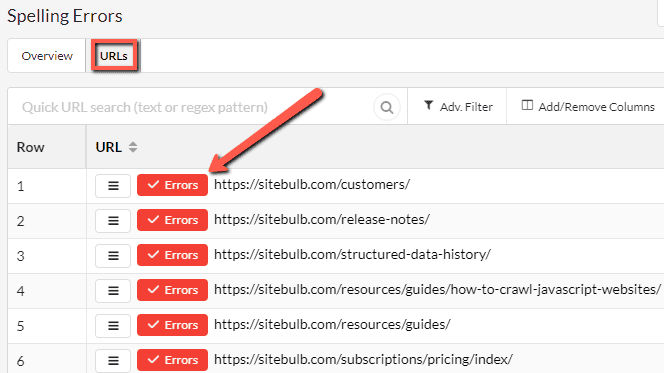
This will present you with an interactive screen that lists the spelling errors on the left, and shows the page content on the right.
Click on any spelling error on the left and Sitebulb will highlight where it is present in the page, on the right hand pane. Note that this will split out the Page Title, Meta Description and Page Body.
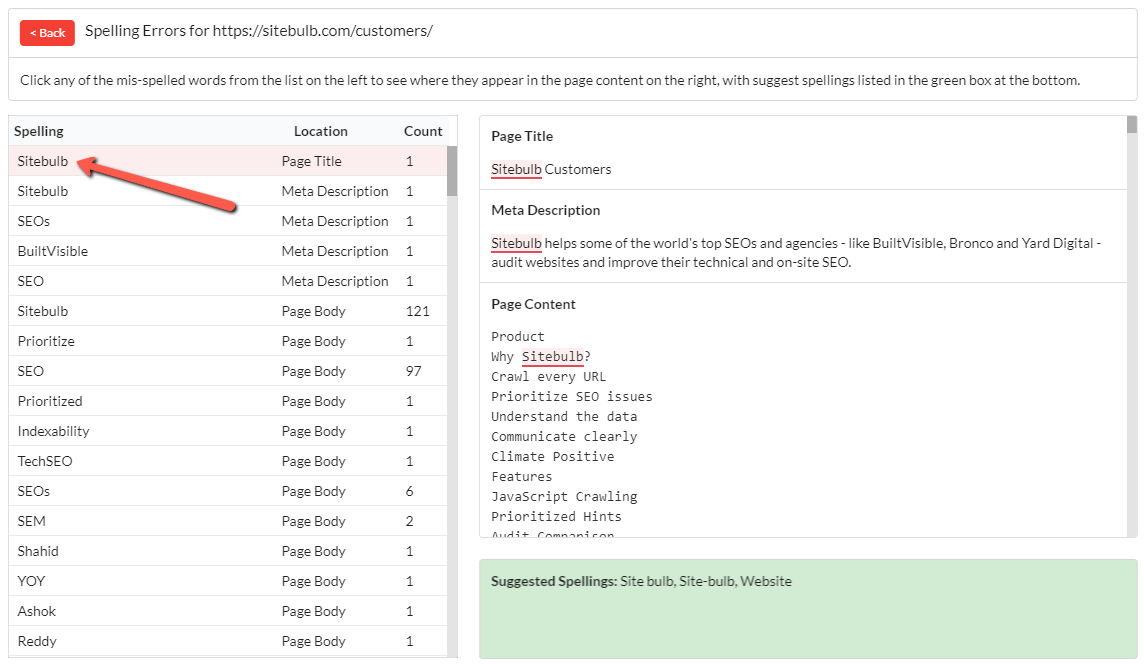
In the green box at the bottom you will find suggested spellings.
As you browse spelling error results, you will notice some words that are not really errors, but are instead names of people or products, or industry jargon terms (like 'SEO' for us).
You can tell Sitebulb to ignore such words in your dictionary, so that Sitebulb will no longer flag them as spelling errors.
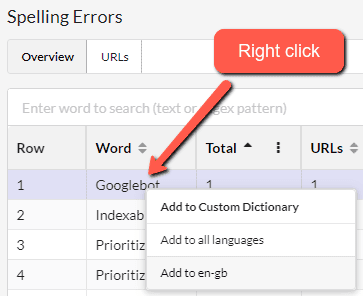
As you are viewing Spelling Errors in the report, you may spot a word that you want Sitebulb to ignore, and you can instantly add it to your dictionary by right clicking on the word.
You'll be presented with the option either to add it to 'all languages' or to add to the dictionary that had been used:
As soon as you have done this you will notice that the word has a strike-through:
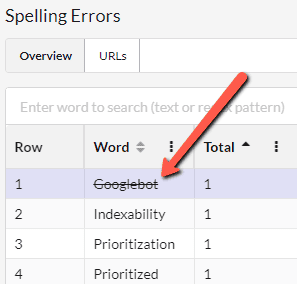
Ignored words will then not appear in generated exports.
You can also add 'ignore' words in bulk, via the audit setup screen. Head to the Spell Checker section and hit Custom Dictionary;
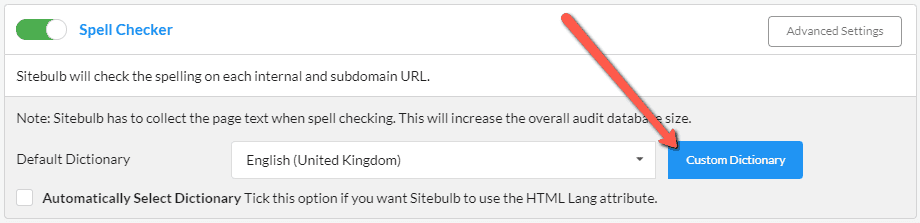
This will bring up a modal window, where you can type or paste words into the box that you want Sitebulb to ignore:
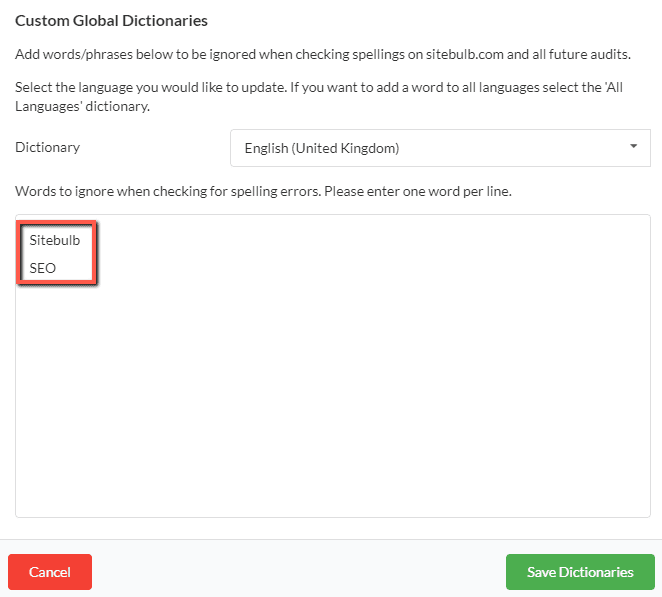
Be sure to hit Save Dictionaries at the bottom before moving on. As soon as you audit the website again, the ignored words will simply not display at all.
There's a few other neat things you can do with it, but to be honest I've droned on enough about spellings, so please check the docs for the rest of that shit.
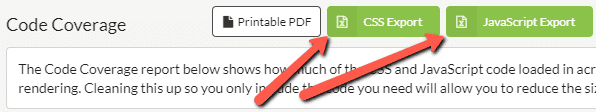
#2 Added code coverage exports
Long time Sitebulb fan and friend of the show Arnout Hellemans is borderline obsessed with Sitebulb's Code Coverage feature, and has been asking us to add an export for many many years, if not more.
I'm fairly sure that what he means is an export of the wastage per file, and not a printout of the CSS/JS wastage files themselves; however this is what we have built:
Cue another tweet coming our way in five, four, three...
#3 Made 'duplicate content by path' exportable
Another serial complainer, Kristine Schachinger, recently asked us to make the 'duplicate content by path' table so that it could be exported.
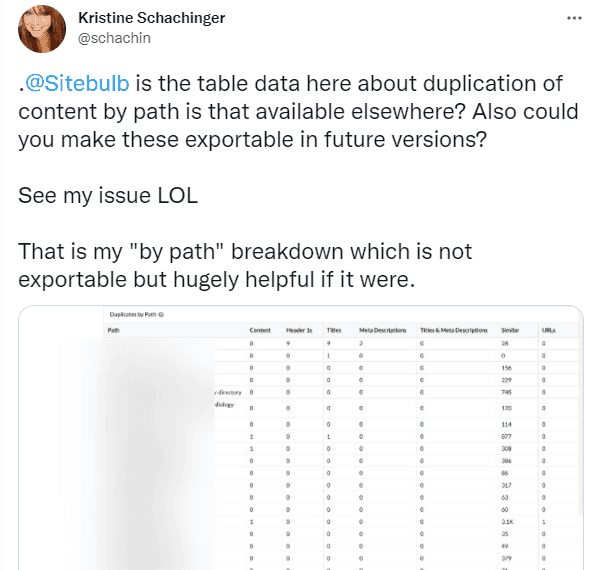
Whilst I take the point that this was last May and that is not exactly 'recent', I would like to point out that most humans have declared that both 2020 and 2021 should not be counted as real years, as a result of them being completely and utterly shit.
So by that logic, we're 4 months early with this feature and should be praised for our prescience. Time is a closed loop, friends.
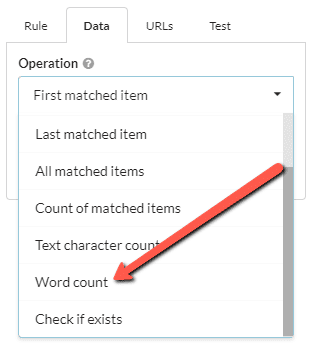
#4 Added 'word count' as an operation option for content extraction
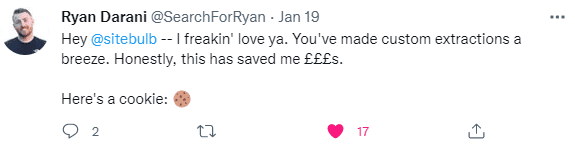
For anyone not in the know, Sitebulb's content extraction feature is game-changingly easy to use.
This tweet is representative of our entire user-base:
We continue to improve the functionality as our customers come up with useful suggestions, such as this one from Sam Underwood, who has featured regularly in these here parts for his great ideas (and incessant whinging about largely insignificant bugs).
This one is a simple improvement, adding the option to count the number of words of the extracted element:
#5 Added more link data to the URL Details page
Sitebulb was the first crawler to automatically detect link location - so it can tell you if a given link lives in the header/footer/navigation/content, and the easiest way to see this data is through the Link Explorer.
With this latest improvement, we have also surfaced it in the URL Details view, so you can better appreciate the effect of links at a URL level:
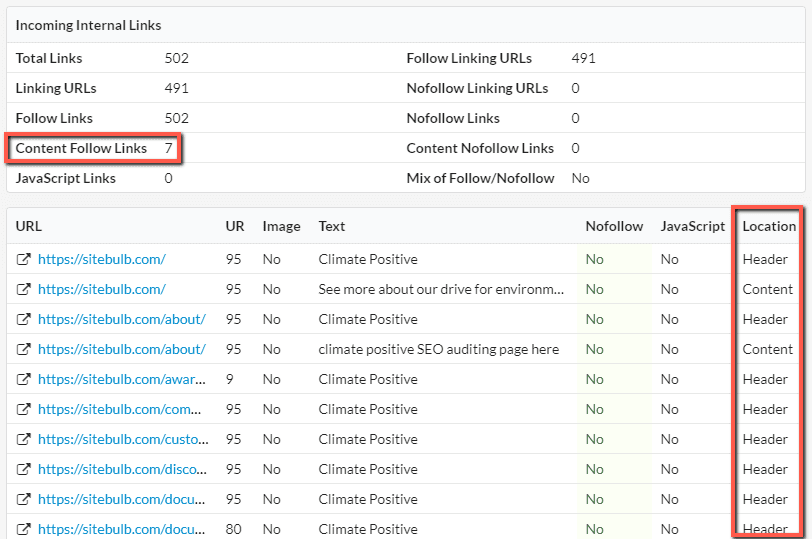
This was suggested by Berian Reed, who said it "would be useful to see at a glance if a URL needs some content internal link love."
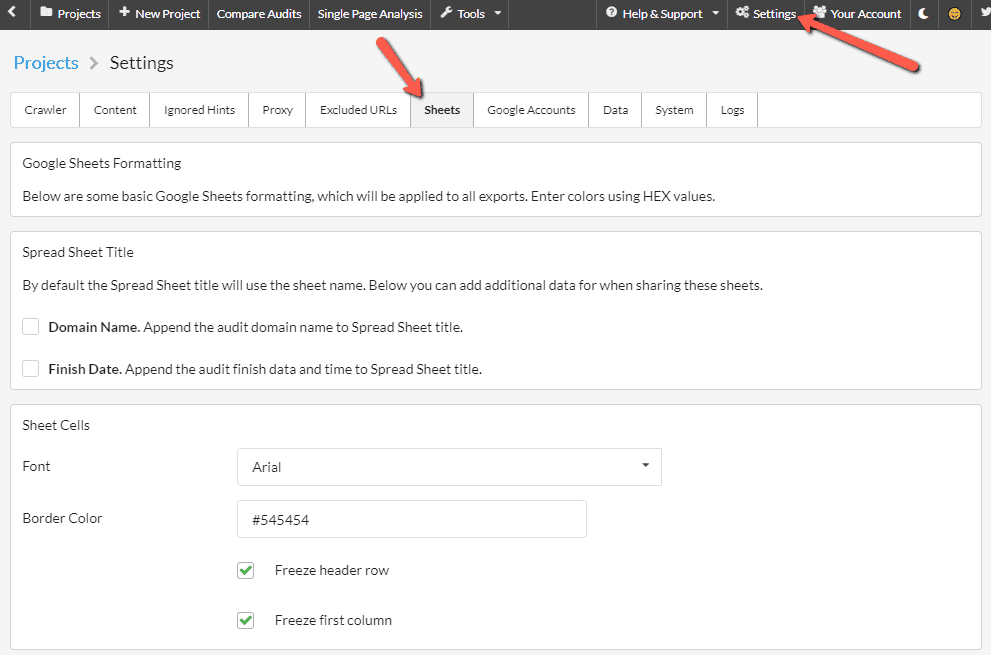
#6 Improve formatting on Google Sheets uploads
We have been taking suggestions from William Sears for years now, and in particular regarding his use of Sitebulb data in Google Sheets. The latest suggestion was along the lines of 'I obsessively format all these Sheets files to get them 'just so' before sending to clients, it sure would be swell if Sitebulb could do some of this formatting for me.'
So these new settings are built specifically to address William's OCD, and they can be found via the global 'Settings' menu in the top navigation, then on the 'Sheets' tab.
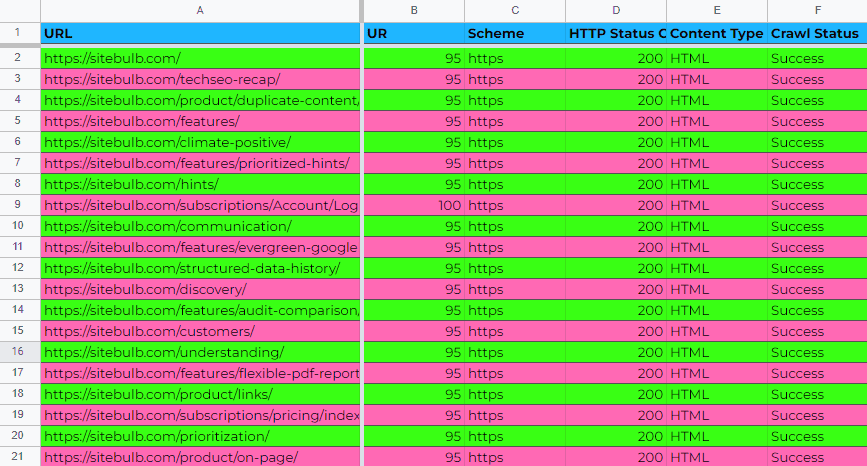
The new settings enable you to preset the following:
- Append domain name and/or finish date to the Sheet title
- Select a different form
- Pick a hex colour for the border
- Freeze the header row and/or the first column
- Pick a hex colour for the header row background colour and font colour, and bold the header row text
- Pick hex colours for alternating rows
Do everything right, and you just might find that you too can produce something similarly God-like;
#7 New Indexability Hints
Every so often we end up in conversations with confused customers, who are dealing with pages that Sitebulb classes as 'orphan pages' by Sitebulb... yet these pages actually have internal links pointing at them.
At first we naturally figured that Gareth must have done something wrong, but as we explored it further, we realised that there can exist a class of URLs that are sort of like orphan pages, but are not really orphan pages.
They had been getting lumped in as orphan pages, but actually they were something else entirely - and something we didn't really have a name for. So we made one up: "Isolated pages".
"Isolated pages are HTML URLs that are not part of the internal link graph on the website, yet can be reached by crawlers."
Isolated pages are similar to orphan pages, but not quite the same. Orphan pages have no internal links pointing to them, and you can't find them with a straightforward crawl of the website. Whereas isolated pages can be found by the crawler, but only through links which do not contribute to the link graph.
I've written up the theory stuff for it, which will get published shortly, but in this version of Sitebulb you can already find the new data in the Indexability report:
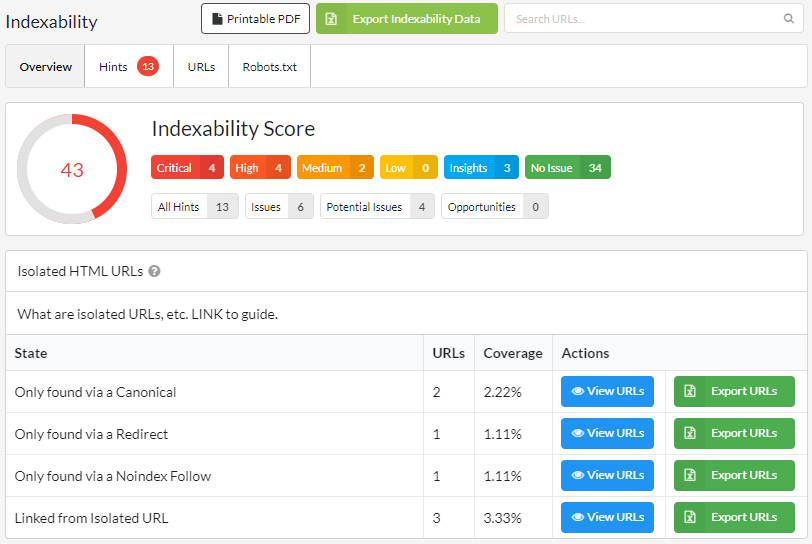
Clicking on 'View URLs' will allow you to see the affected URLs and dig in further to investigate the issues, or you can easily export the list to CSV or Sheets via the 'Export URLs' button.
The 'Learn More' pages for each of these Hints contain specific instructions for how to tackle each type of isolated page:
- Isolated URL - only found via a canonical
- Isolated URL - only found via a redirect
- Isolated URL - only found via a noindex,follow
- Isolated URL - only linked from other isolated URLs
If you want more info about how to tackle isolated pages, please check out our documentation.
#8 'Compare Audits' option
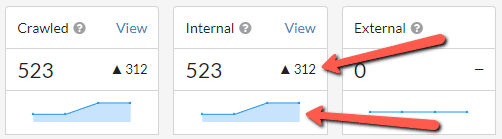
Sitebulb has lots of comparison based data to show historical changes in a project. This sort of stuff:
However, up until now there has been no way to compare two audits from entirely different projects. Indeed, many pundits had commented that this was Sitebulb's only shortcoming.
And there are of course lots of reasons why you may wish to do it;
- To check a website before/after technical work has been carried out on the site
- To compare a dev site to a live site
- To compare mobile and desktop versions of a site
- A dev fucked something up, and you want proof it wasn't like that before
So we figured we better got in with it, and added a new Compare Audits section in the top navigation:
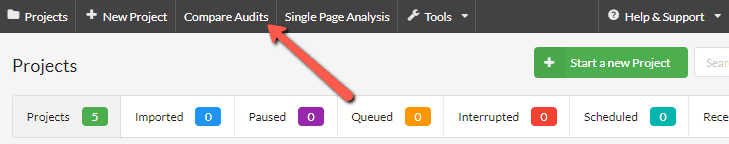
If you hit that button, you'll then you'll be presented with a screen that allows you to pick any two Projects, and any audit from within each Project:
Once you hit 'Compare Audits', the results of the comparison will show underneath:
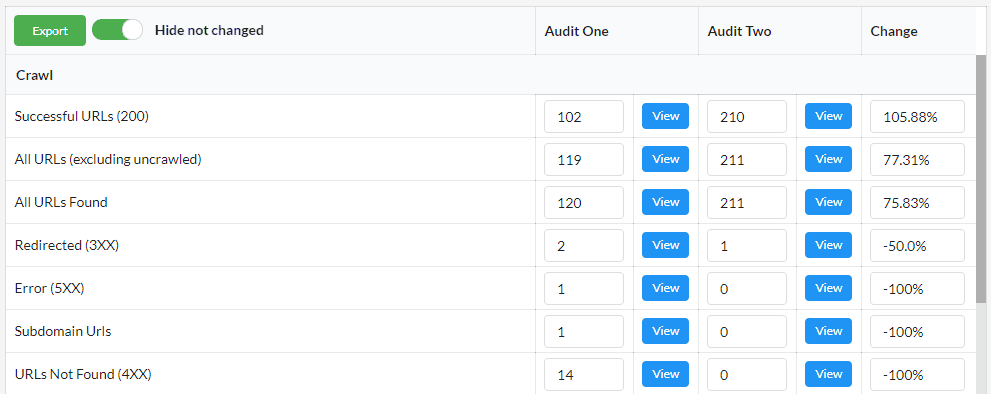
At this point you can scroll through to analyse all the results from the different reports (toggle 'Hide not changed' to make this easier), or export into CSV format to view in a spreadsheet.
Gareth said he can't get this one to push into Google Sheets, so it's CSV only for now (because: 'reasons').
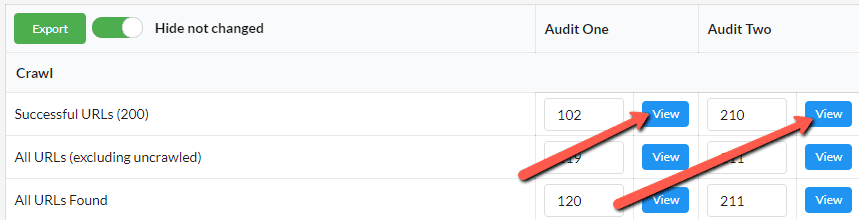
If you wish to dig into specific results, you can click View alongside any URL total. This will open up a separate Sitebulb window showing the specific URL List for the audit. Also click the View button for Audit 2, then you will have two windows that will allow you to compare side-by-side.
If you are working on a titchy-screen laptop, the side-by-side view will be entirely impossible to comprehend. If this is the case, instead do 'Ctrl + Click' on the View button:
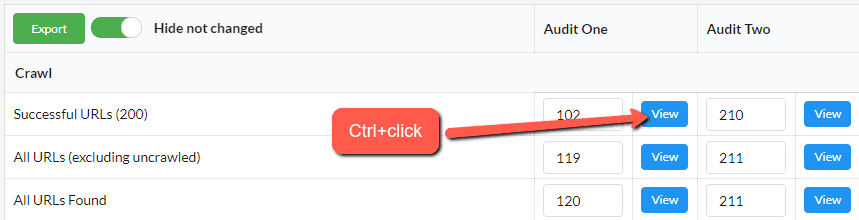
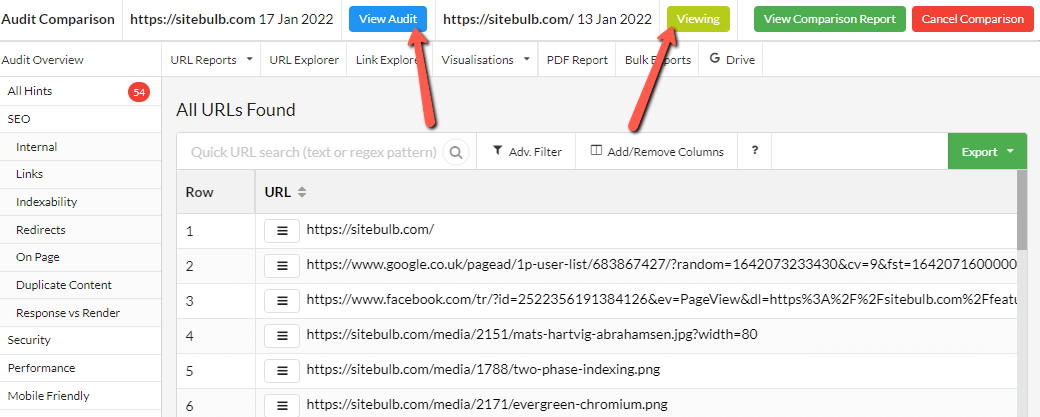
This will generate a 'single pane' view, that allows you to easily jump between Audit 1 and Audit 2:
#9 New URL Reports dropdown
Despite our excellent signposting in the tool, some users STILL GET LOST. Oftentimes, these folks just want to go straight into a list of URLs, and they don't want to waste precious time looking through insanely useful Hints or marvelling at beautiful visuals.
We added this feature specifically for them - a straightforward dropdown menu that allows them to instantly jump into a pre-filtered list in the URL Explorer.
Aside: we also moved some shit around that will confuse the fuck out of lots of people. We're running out of space for everything!
#10 Pause audit when computer is running out of resources
This is a excerpt taken from a real-life customer support ticket:
Customer: Sitebulb is crashing, why????????
Us: Ok, let's get to the bottom of this. What was happening before it crashed?
Customer: It was hanging, so I clicked pause then resume then pause again and then resume and nothing happened
Us: Could you please share a screenshot of your Task Manager
Customer: Sure, here you go:
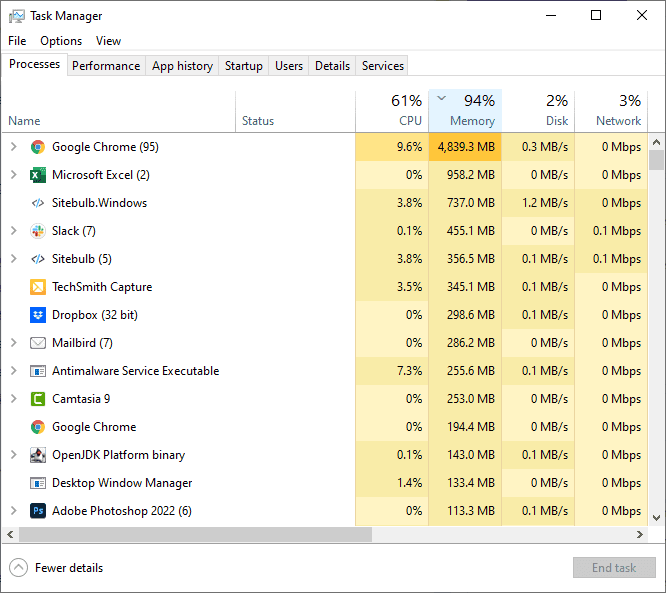
Us: Could you perhaps close the 95 Chrome tabs you have open that are using up all your RAM?
Customer: Erm...yep. I don't even need them to be honest.
Us: Ok, do that, then try Sitebulb again please
Customer: Just letting you know it's working fine now. What a weird coincidence!
Us: ...
Here's the rub: Sitebulb is a desktop application, which means that in order to run, it needs to use the CPU and RAM of the machine it is installed on. It also means that when Sitebulb completes an audit, it writes data to the local hard drive (rather than to the cloud, as with cloud based crawlers like DeepCrawl or OnCrawl).
This means that, under certain conditions, Sitebulb can run out of resources. And when it does...bad things happen.
This is also true in general - trying to use a computer which has basically no resources left is an excruciating experience.
So, we've tried to put some catches in place to deal with this in a more elegant manner, that trigger before you actually run out of resources. Now, Sitebulb will detect if you get low on hard disk space or RAM, and pause the audit to allow you to resolve the issue. You'll see something like this:
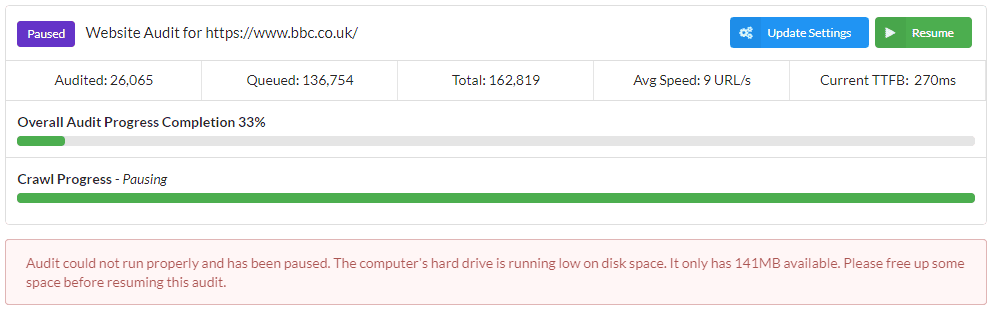
The reason we have these safeguards in place is because in this state you are teetering right on the edge of what your machine can feasibly handle, and pushing it any further would most likely cause your entire system to crash, losing any unsaved work in the process.
If you find yourself presented with this message, either follow the simple on-screen instructions, or consult our documentation for a bit more detail on the issue and potential solutions.
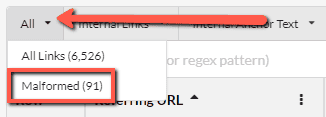
#11 More data shown for malformed links
One of the Links Hints is; 'Has outgoing links with malformed href data'. An extremely useful Hint, one must agree.
However, Maret called in to ask, 'how the blahdy hell am I supposed to find the actual malformed links themselves?'
Eloquently put, Maret. And we agree that these were essentially impossible to find, rendering the Hint nigh on useless.
So we improved the experience, adding a button in to jump directly to the malformed links found on each URL:
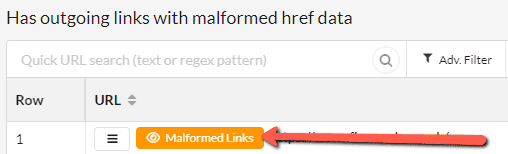
This will take you to the Link Explorer, where you can see the malformed links themselves:
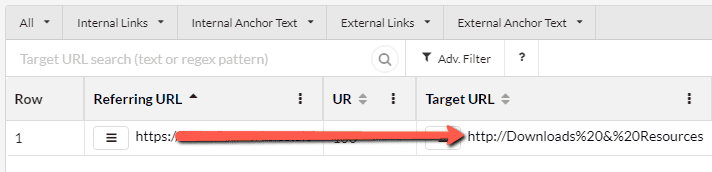
This will show you all the malformed outgoing links from the referring URL you originally selected. However, you may wish to see all the malformed links in one view, and you can do this by using the dropdowns in the Link Explorer menu - go to All -> Malformed:
Fixes
- UI issues in content extraction and content search.
- Re-auditing failed URLs was not re-generating the export files.
Version 5.5
Released on 20th December 2021
Updates
Everyone agrees that Cloudflare is awesome, right? CDNs in general, actually. They speed up content delivery, they're more reliable, and they offer better security. Great all round.
But to crawlers, they are like a fucking plague. They 'protect the website owner's best interests' with aggressive 'bot detection and blocking', which means that any SEO they hire can't crawl the site to tell them what things to improve... to make their website better.
And they're constantly changing, shifting and mutating to find new ways to stop poor, innocent SEOs from getting on with their jobs.
Well, with this update we've taken the fight to them, giving Sitebulb a booster shot that makes it significantly more robust when dealing with CDNs. So if you've had a site you've been struggling to crawl lately, give it another try on this update!
Additionally, we've updated headless Chrome to the latest stable version (v97.0.4691.0) - which also helps with this stuff.
Fixes
- Sitebulb was inaccurately flagging the Performance Hint 'Properly size images', because it was being tricked by SVGs, which are well known in the crawling-software community for their Loki-like properties.
- On sites with 'disallow all' in the robots.txt file, Sitebulb would refuse to let you 'respect robots'. You'd save it and then in the background it would sneakily change back, like a brazen four year old stealing cookies from the jar the second you leave the room. Little fucker.
- A couple of small structured data fixes, to tackle issues caused by regional differences in number formatting.
- Fixed an issue where Sitebulb was falling over when doing accessibility on a particular website (Dev notes were literally, 'You can see from the screenshot she's sent us that the accessibility checker is shitting itself').
- One of our users showed us a site that Sitebulb could not finish crawling, because all the structured data it collected caused the database to explode (not literally, it just got really really big) - this was because it was heavily nested and Sitebulb was trying to be too clever. Anyway we only saw the issue for that one site, so unless this site was your site, you probably could have stopped reading 15 seconds ago.
Version 5.4
Released on 25th November 2021
Fixes
- Some users were having issues exporting to Google Sheets (in particular 'All Hints'), so we rebuilt the upload system to work more reliably.
- Fixed a bug on the Crawler Settings when setting a URL Limit over 1 million URLs.
Version 5.3
Released on 18th November 2021
Updates
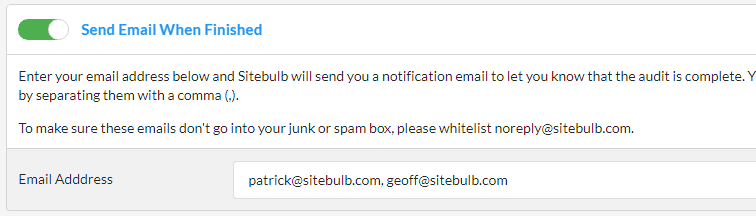
#1 Added an optional 'audit completed' email alert
We get it, it's 2021 now. SEOs are busy people, attention taken by machine learning, and NLP, and AI, and y'know... Twitter. It's no wonder folks are forgetting to check if their favourite SEO tool has finished crawling yet.
Well now you don't have to! When setting up an audit, head to Crawler Settings from the left hand menu, and you'll see a new option to 'Send Email When Finished.' Enter your email address in this box (or multiple addresses, comma separated) and Sitebulb will send you a friendly email whenever your audit is finished.
Pairs perfectly with a nice scheduled audit.
#2 Added more ways to view image alt text
Sitebulb team: 'Hey SEOs! We've released a revolutionary new way to compare response HTML to rendered HTML. Nice huh?'
SEOs: 'Is that it?'
Sitebulb team: 'Erm, actually, no! We also added Web Vitals metrics that are collected while you crawl!'
SEOs: 'Hmmm.'
Sitebulb team: 'Don't act like you're not impressed.'
SEOs: 'This stuff is great and all, but does it really move the needle?'
Sitebulb team: 'What is it you want to see?'
SEOs: 'Image alt text'.
Sitebulb team: 'Oh.'
Sitebulb has already been collecting image alt text, to be fair, but not doing a great job of making it accessible. So we've made it a lot easier to find, chucking it bang slap in the middle of the On Page report.
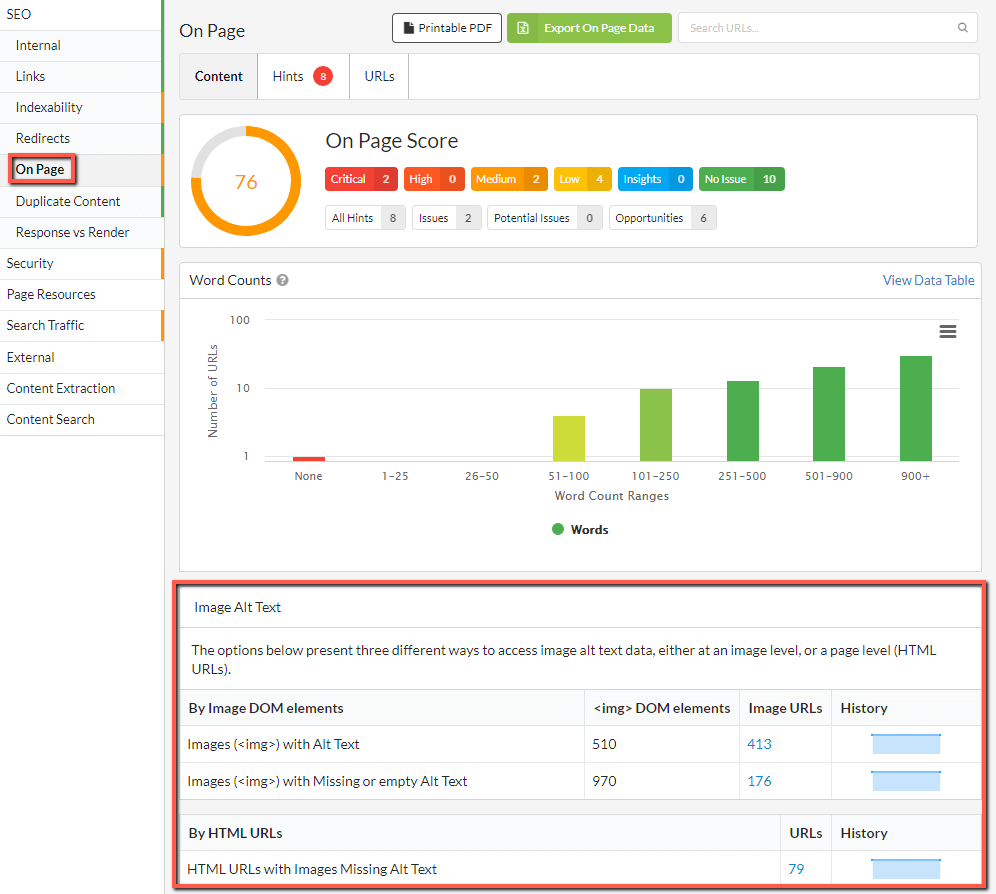
We also now provide various different ways to interrogate the data too.
I hope you're happy in the end.
#3 Re-jigged 'Readability' setting and turned it off by default
With v5 we switched to a new audit setup workflow, and it's fair to say that we mangled the 'Advanced Settings' options for SEO. We'd made 'Readability' an option you could switch on/off, yet if you did switch it off, Sitebulb would not collect on-page data like h1s. This caused levels of bewilderment and head-scratching not seen since Man Utd appointed Ole Gunnar Solksjaer as manager of an actual real life football team.
So we have adjusted this to ensure that all on-page data is collected by default, and the readability on/off switch only relates to readability and sentiment scoring.
We have also made this switched off by default. Pourquoi? Because analysing this data is quite expensive (computationally), which puts greater strain on your computer (and your carbon footprint), and is only really necessary when doing content audits.
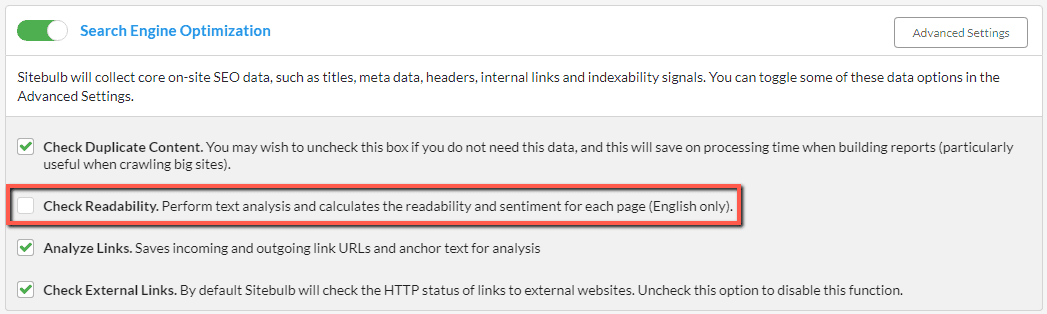
If you do want this data, simply check the box to switch it on.
#4 Added a search field to GA property list
Sometimes, we here at Sitebulb underestimate how wildly successful our customers are (which of course should be directly attributed to Sitebulb), and we had not anticipated that they would have Google Analytics accounts with literally thousands of website properties.
And that they were too busy and important to scroll their mouse.
Following our latest update, these disgustingly rich and successful users can simply type into the search box at the top of the dropdown, and have the property served up to them on a silver platter, exactly how they like it.
#5 Improved the 'support window' in the tool
Every four or five years, we find that a user has actually had an issue with Sitebulb and wishes to report a bug. I know this sounds far-fetched, but please stay with me.
Since we are committed to 100% bug free software, we encourage any and all such feedback, however infrequent. So we have a little 'Contact Support' option in the 'Help & Support' dropdown menu:
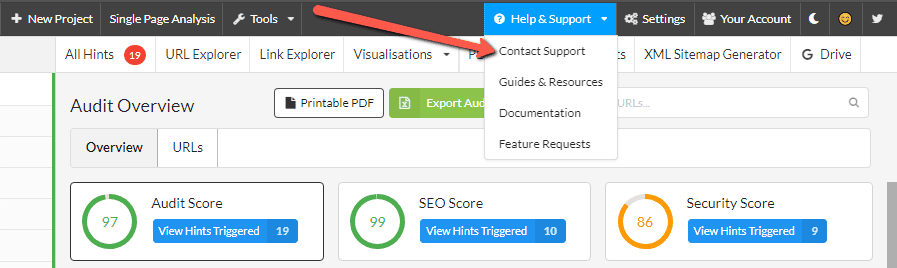
This opens a modal which allows you to send us a nice message, or report a bug (unlikely). We have redesigned the modal window that appears, offering self-help suggestions from our documentation:
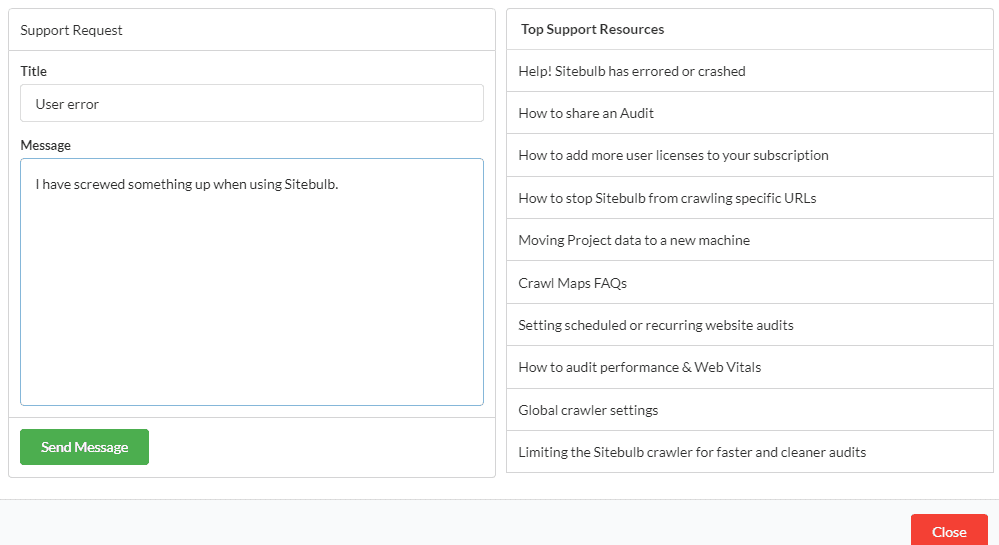
We have also adjusted how this modal loads in, so it no longer takes you away from the thing you were doing. Rejoice!
#6 Updated all the structured data validation
If you've not been paying attention, earlier this year we launched a free service that alerts you to changes in Google Rich Result requirements and Schema.org updates. I signed Gareth up for the alerts system, so now he just goes and updates Sitebulb based on the alerts that hit his inbox. There's pretty much nothing to dev work, IMO.
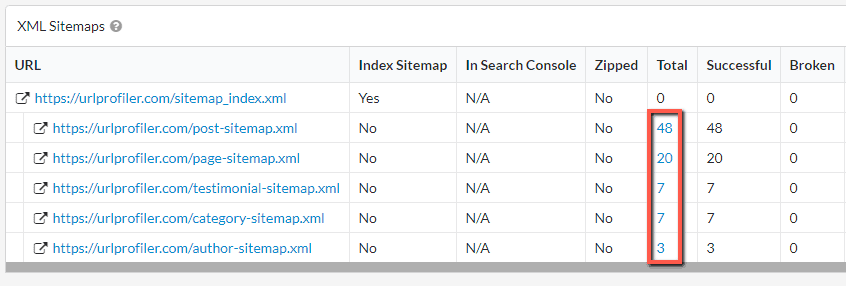
#7 Click through to URL Lists of sitemap URLs
Within the XML Sitemaps report, you can now click through to URLs from a specific sitemap, via these linked values in the sitemap list. This was from one of those Twitter feature requests that made us go, 'oh yeah, that makes sense.'
#8 Added filtering options to content search and extraction
Content search and content extraction 'URL' results now allow you to do the same kind of advanced filtering as you can do on normal URL Lists, which to be honest we probably should have just added from the beginning.
#9 Updated Chrome to version 93
Per our commitment to evergreen Chromium, Sitebulb is now using version 93, for the best crawling and rendering experience available on earth.
Fixes
- We've been getting a bunch of users inadvertently ending up in a state where all new Sitebulb audits get queued. Even if there was nothing to queue behind. As a British company we are proud of our heritage and longstanding reputation as magnificent queuers, but even we thought this was taking it a little too far.
- A rather annoying hreflang issue that meant Sitebulb would not list URLs on different ccTLDs, falsely claiming that your site was responsible for all sorts of heinous crimes.
- Sitebulb was getting stuck failing to crawl some sites due to 'handshake failed' errors. I don't really know what anyone bloody expected, we've not been allowed to shake hands for literally years now, this was bound to happen eventually.
- Content extraction would get screwed up whenever you tried to use attributes. Firstly, it would not save the attribute you were using (less than ideal), and secondly it would not display correctly in the tool (also marginally below par).
- A website was getting errors that read 'object reference not set to an instance of an object.' This is an error that .NET spits back when trying to access something that has not been properly defined, and as 'chief tester', I have a hate/hate relationship with this error. In fact I would probably say it is my sworn enemy.
- The 'All Hints' export, famed for it's quite delightful integration with Google Sheets, was spitting back some 'pre-v5' performance Hints when you did the CSV export. As an Excel lover I do cherish other users sticking so steadfastly with CSVs, but even I must admit that the Sheets version is waaay better (BTW we did actually fix the CSV bug).
Version 5.2
Released on 29th July 2021
We have an unwarranted reputation as 'Mac haters'. Truly, I do not know where such propaganda stems from, as we have nothing but love for Macs, and I challenge any individual to present evidence of a contradictory position.
Anyway, despite our predilection for all things Mac, in our last update we managed to introduce a bug which meant that some websites would not crawl on Macs, when they would crawl on Windows. This update includes a fix for these crawling issues, so if you are an unfortunate Mac user, please make sure to update!
Updates
Added a veritable panoply of structured data updates;
- Added an error to priceRange when it is greater than 100 characters.
- Removed @id from LocalBusiness
- Added SeekToAction to VideoObject
- Added directApply added to JobPosting
- Added funder added to Dataset
- Updated to Schema.org version 13
- Added gtin to Product
- Added BackOrder to Product availability
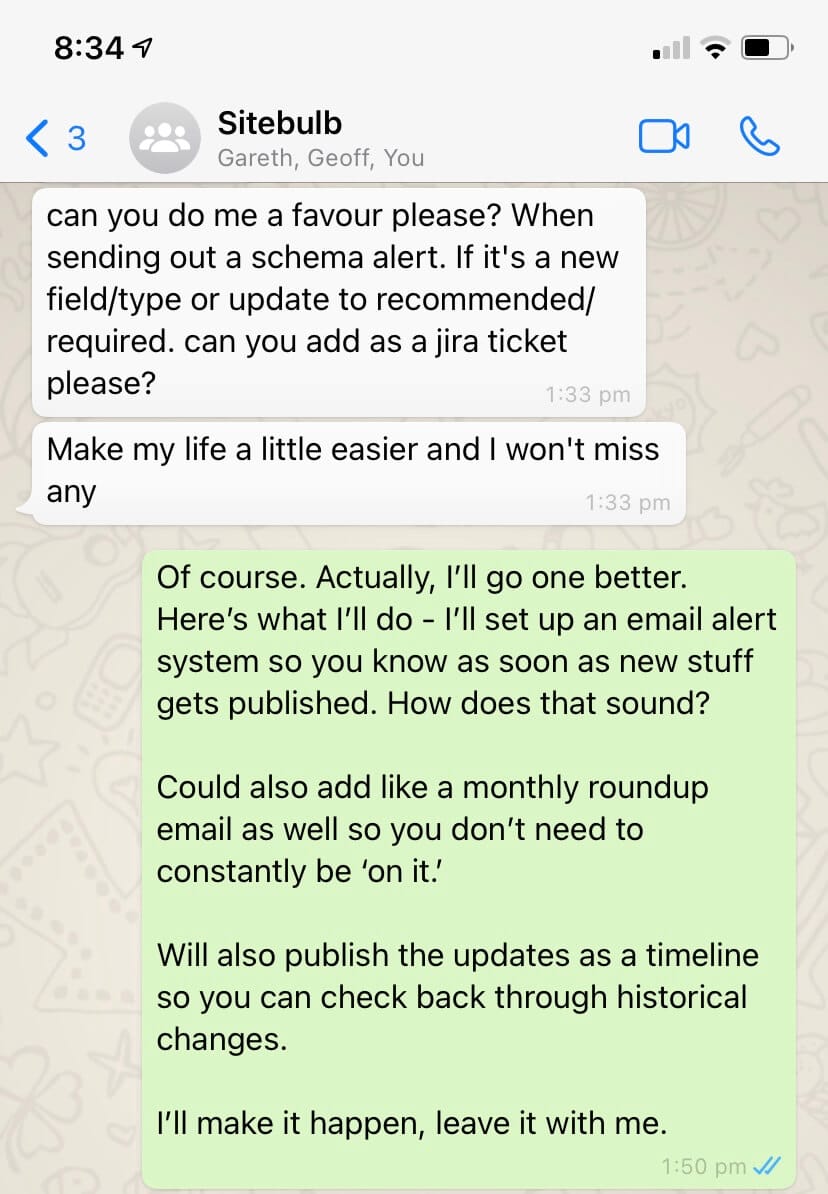
When working on these updates, Gareth sent a message to our group WhatsApp, asking me to add a Jira ticket whenever I add a new structured data alert to our change history page.
My response was typically professional and supportive:
Fixes
- Aforementioned Mac crawling issue was fixed, and to not mention it here would be to deny my completist tendencies, which I am not wont to do.
- The 'All Hints' report was not working in conjunction with our new 'pick and mix' audit options, and would only show if 'Search Engine Optimization' was ticked. It will now work whatever selection you choose. Personally I like a mix of the fizzy ones and white mice. Don't judge me.
- When connecting Google Search Console, Sitebulb was having issues recognising domain properties.
- Sitebulb was incorrectly flagging pages with HTML lang as 'not having HTML lang'. When challenged on why this was happening, Gareth's response was 'I had an IF statement the wrong way around.' Which, if you ask me, is kinda worrying...
- Adding the column 'Natural Height' to a URL List would cause an SQL error on some lists. I am not really sure why we don't just include 'Natural Height' on every URL List by default, since height related data is central to almost all SEO strategies (e.g. 'what is the natural height of Barack Obama').
- On sites with AMP equivalents, ticking AMP would make Sitebulb think that HTML pages are actually AMP pages. This would have the unfortunate consequence that Sitebulb would therefore not collect things like link data, structured data, performance data and whatnot. It would have been a more disastrous bug if we had not all concluded that AMP is basically now dead.
- When setting up a sample audit, if you went to the crawler settings, the 'depth limit' controls had mysteriously disappeared.
Version 5.1.1
Released on 12th July 2021 (hotfix)
Fixes
- Fixed the Hint: 'Images with missing alt text'... so apparently this disappeared in version 5, and we somehow managed to not notice it was gone. I asked Gareth what happened and he started waffling on about nulls, and 0s, 1s, and how you can't null a null and all this shit. TL;DR the Hint had stopped triggering when it should have, and now it is fixed so that it does fire again.
- Fixed an issue in the audit setup where the language setting would not let you add new languages.
- Fixed an issue with structured data which was inaccurately claiming some 'recommended' properties were actually 'required' for the Local Business Search Feature.
Version 5.1
Released on 1st July 2021
Wouldn't it be wonderful if, just once, England could beat Germany in the knock-out stages of a major tournament?
Oh, wait hang on. I said the wrong one.
Wouldn't it be wonderful if, just once, Team Sitebulb could manage a major release without the inevitable and embarrassing 'bug fix update' mere days later?
Apparently not.
Fixes
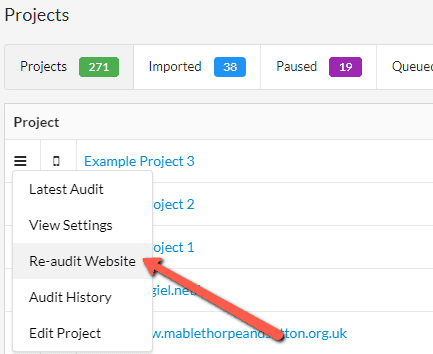
Reaudit from side menu actually now works
Folks using the burger menu on the left hand side of the Projects list in order to 'Re-audit Website' were being treated to a green 'Start Audit' button that did literally nothing. They would press the button and Sitebulb would just sit there like a fucking lemon.
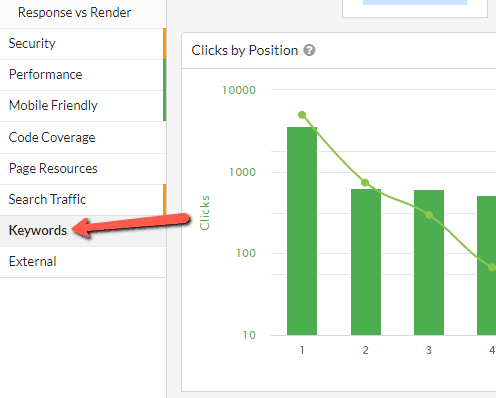
Keywords report no longer completely missing
Considering that one of the few things I actually do around here is 'chief tester', this one has to go down as one of my worst fails this week (top 5 at least I reckon).
The Keywords report was literally not there at all. We were collecting the data, but not even showing it as a menu item on the left.
Facepalm.
'Treat subdomains as internal' was not treating subdomains as internal
This feature had literally one job! How do you fuck that up?
Exports from Link Explorer had displaced column headings
In the URL Explorers and Link Explorers we added a new 'Row' column in the UI, to make it easier to scan the data. However we were also pushing this through to the spreadsheet exports, and for some reason we'd forgotten to set the column header for Link Explorer exports. Which meant that the column headings did not line up as they should, and no longer made sense.
Considering that spreadsheets are literally a numbered list of rows and columns, we figured we could probably do without the row data on exports entirely...
Improved message for JS/CSS/images blocked by robots.txt
This is technically an improvement rather than a bug fix, but I'm so embarrassed by the farce that precedes this one that it does not deserve to be considered an 'Update'.
Now, if you crawl a site that has resource files blocked by robots.txt, Sitebulb will tell you what they are in a little notification box:
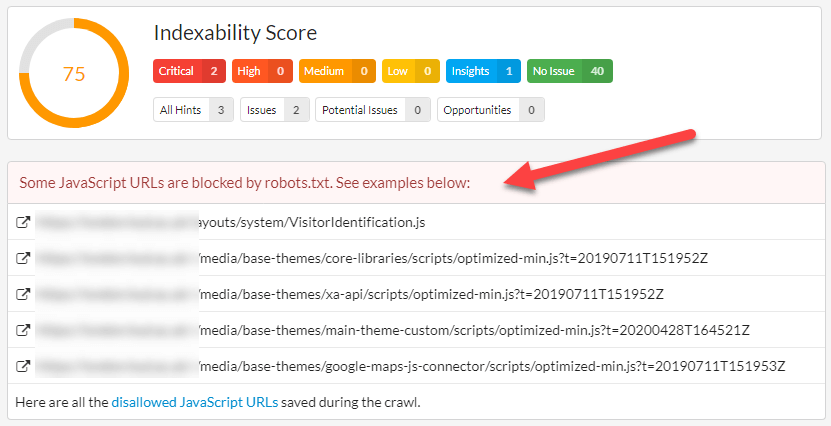
(Note that the bottom line links to a list of disallowed URLs, if and only if you tick 'Save disallowed URLs' during your audit setup).
Version 5.0
Released on 28th June 2021
Every time we do a major version update, I forget how looong it takes. We've been working on this one for pretty much all of 2021, and it represents the biggest change to how Sitebulb actually crawls websites since we first added headless Chrome back in 2018.
Here's a quick bullet list of the changes, with jump-links to make you life easier, should you need them:
- Brand new Performance report
- Lighthouse audit across every page on your site
- Performance budgets
- New audit setup process
- Open audits in new windows
- Single Page Analysis given more of the limelight
- Re-audit without pre-audit
Brand new Performance report
Google's longstanding promise to factor Core Web Vitals data into their page experience signal has sent the industry into a tailspin over recent months, as deadline day approached and every scribe across the land penned an 'everything you need to know' guide. The inevitable adjournment was, in my opinion, further evidence that we will not see widespread change when it does indeed come to be.
With my soliloquy complete, I may now put forward our attempt at make Web Vitals data accessible at scale:
Our journey to this point was tempestuous, with many twists and turns along the way. As we went, we came to certain realisations, and determined some decisions, defining our philosophy:
- CrUX 'field' data is useless for auditing - the data is SO sparse on most websites that trying to collect it at scale is a joke. You can't make decisions based on a table full of 0s, so we do not include field data, and suggest you leave that to Google Search Console.
- Sampling 'lab' data is the way forward - there is no universe where you need to be collecting lab data for every page on your site, sampling is a much more efficient way to collect Web Vitals data.
- Data can be collected directly from Chrome - there is no need to connect to the PageSpeed Insights API or use Lighthouse (both of which require you to hit the page again), we can just collect this data directly from Chrome first time around.
This is a lot to unpack, and to some extent requires a mindset shift from the typical task-based approach to performance auditing, which typically starts with 'bulk grab CWV data for a massive list of URLs.'
As such, we have ended up with a system that allows you to do the following:
- Collect Web Vitals metrics with the Chrome Crawler as you crawl: LCP, CLS, TBT, TTI, FCP and TTFB.
- Crawl the entire site, yet set a sample % for collecting Web Vitals (recommended 10% sample).
- Run the Lighthouse ruleset (Opportunities and Diagnostics) across every single web page crawled (not just the sample).
- Collect code wastage for all CSS and JavaScript files across the entire website.
- Apply Performance Budget calculations based on the resource files found.
I expect these boring words do not do much to inspire, so I'll show you some images instead.
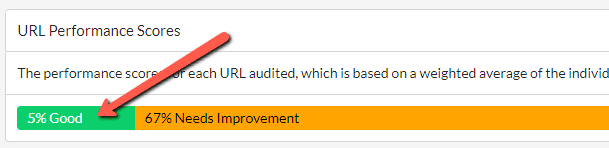
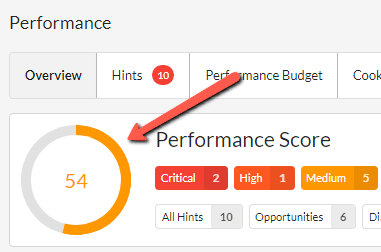
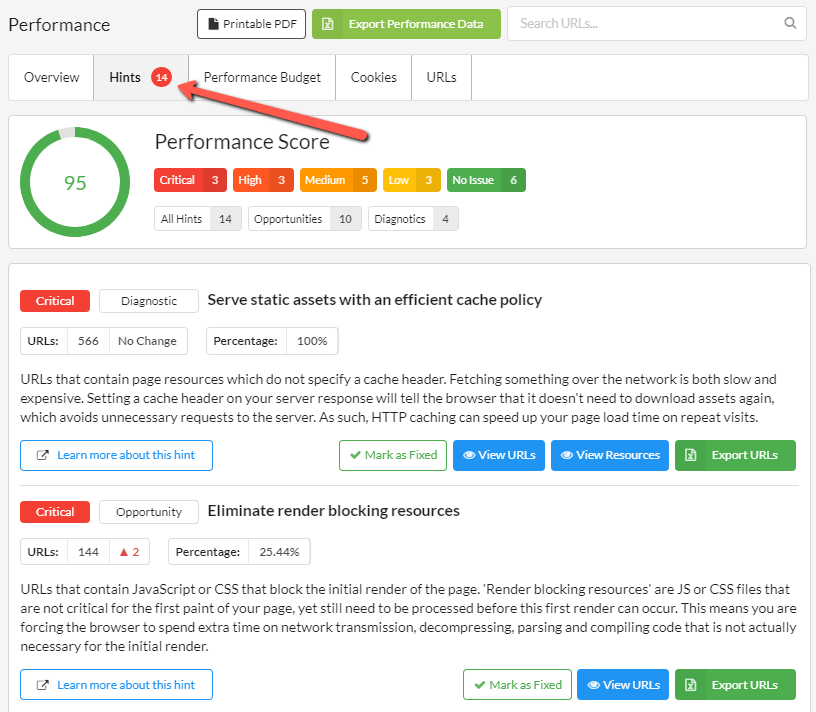
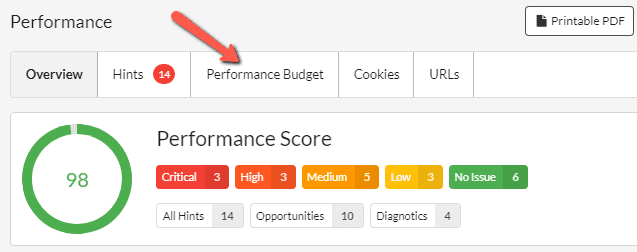
Performance scores
The first thing you see in the new performance report is the big Performance Score at the top, followed by the green/orange/red bar underneath showing the individual URL performance scores.
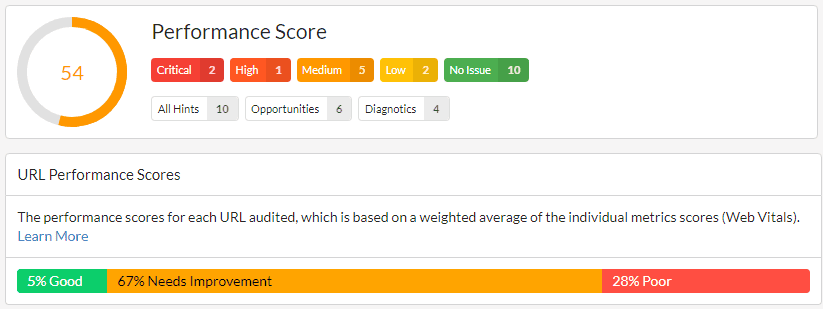
The big score at the top relates to the overall average score of the website, for all URLs tested. The green/orange/red bar shows how the URLs split out individually.
These scores are based on the following thresholds:
- Good (green) - 90 to 100
- Needs improvement (orange) - 50 to 89
- Poor (red) - 0 to 49
These scores are based ONLY on the URLs that were sampled, and ONLY using Web Vitals metrics.
The scoring methodology is based on the Lighthouse Scoring Calculator, which takes Web Vitals data and translates this into a weighted average:
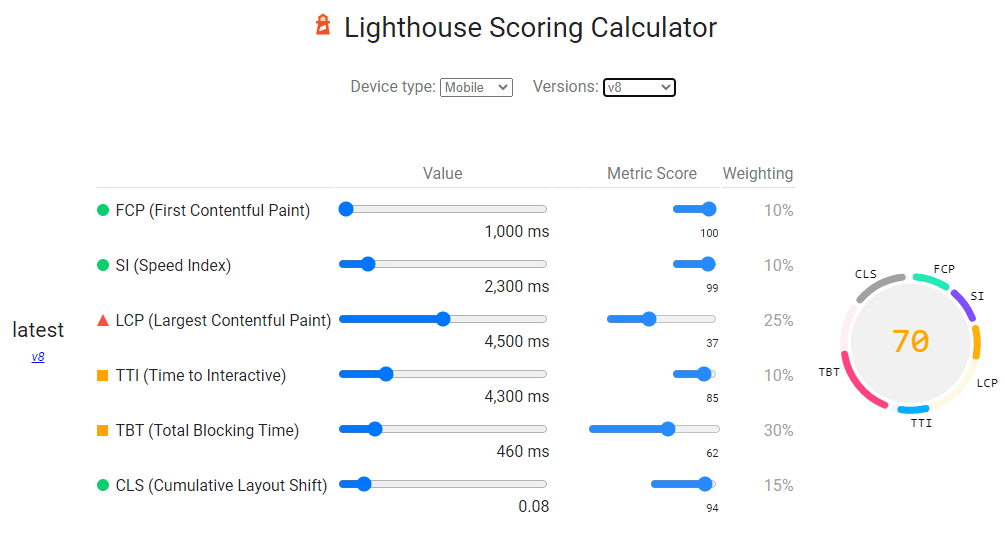
As you can see, the furthest right column shows the weighting, so the FCP contributes 10% to the score, whereas LCP contributes 25%, etc...
Sitebulb does the same thing - for every URL sampled, it calculates the Web Vitals scores, then applies the weighting like above to end up at a performance score for the URL.
This is just like when you see a single URL score in Lighthouse or PageSpeed Insights:
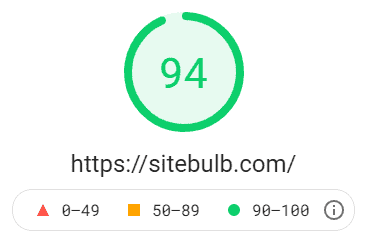
To see individual URL scores in Sitebulb's performance report, you can click through from the chart:
To end up at a list of URLs, where you can see the performance scores in the third column.
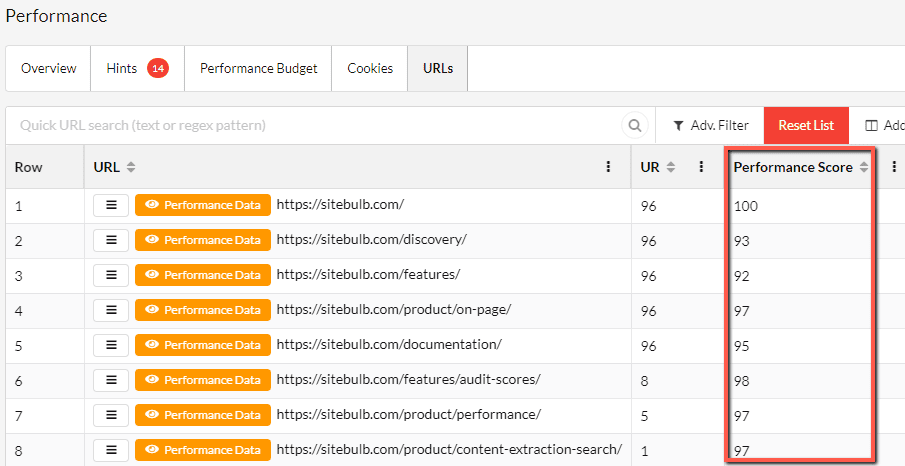
You can also click the orange Performance Data button to isolate a single URL and see all the Web Vitals metrics, along with the score:
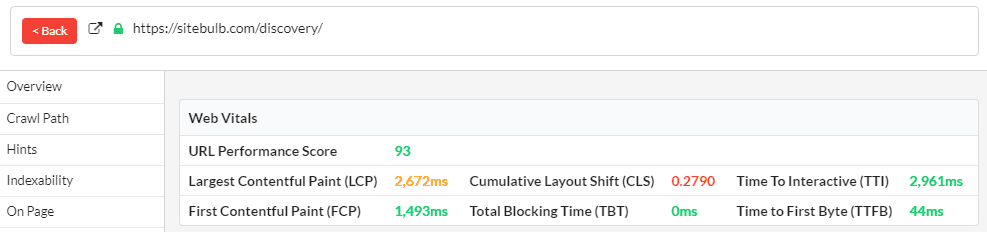
And finally just to re-iterate, we have just explored how to dig in and look at the performance score for an individual URL, but the big performance score at the top is the average of all the URLs that were sampled:
Web Vitals lab data
On the audit overview, directly underneath the performance scores, you will see the Web Vitals charts:
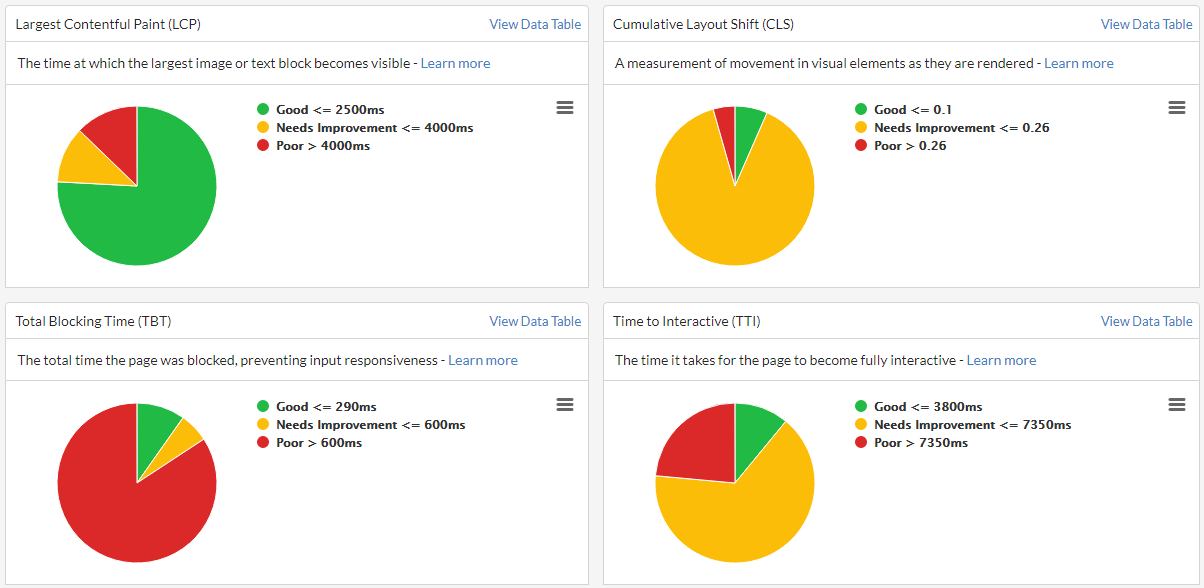
It's super important to understand that this is lab data, not field data.
I know I said it at the beginning, but I want to say it again because you probably forgot. Don't beat yourself up about it - you've had a lot on recently.
We all forget marginally important information once in a while, it's fine. In fact, just the other day I forgot Gareth's surname (later on Geoff pointed out that I should just think about Reservoir Dogs if I need a reminder).

Anyways, you can dig into the Web Vitals data further, simply by clicking on the relevant pie chart segment:
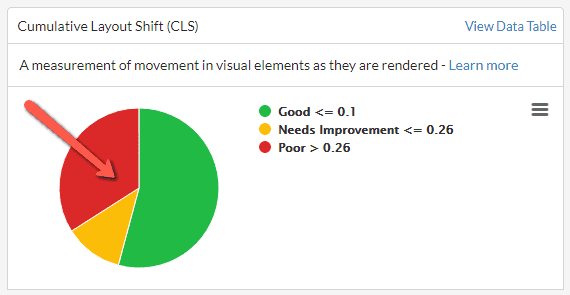
This will bring you through to a URL List that contains all the URLs within the segment selected:
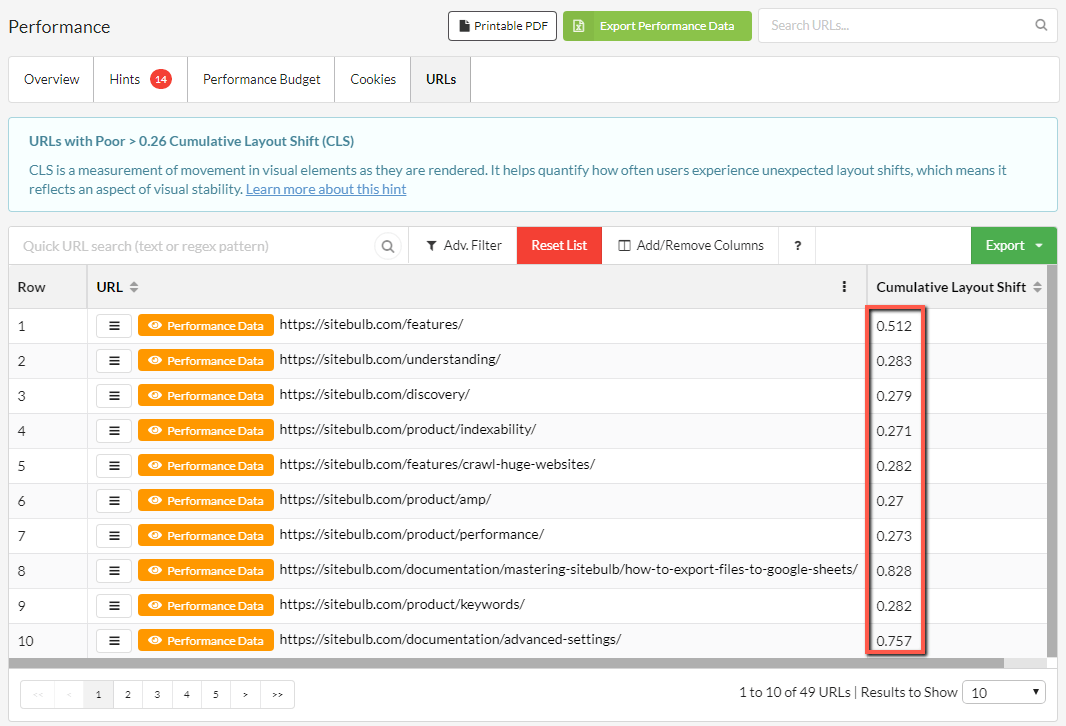
At this point, analysing the URLs to identify patterns in the URL structure can allow you to isolate specific HTML page templates that all share a common issue (e.g. 'Poor CLS on product pages').
Lighthouse audit across every page on your site
Of course, we have Hints as well, in the usual place:
These Hints are processed for every single URL crawled, not just the ones sampled for Web Vitals.
The Hints split into two different categories:
- Opportunities, which present optimization opportunities that can help you speed up your site and improve performance, such as reducing server response time.
- Diagnostics, which flag specific problems on your site that need to be addressed, such as pages with enormous payloads.
These reflect the same issues that Lighthouse use, and we have deliberately used the same wording so you can match the issues up when digging in further with Lighthouse.
What this effectively means is that when you run a performance audit with Sitebulb, you can run the Lighthouse ruleset against every single one of the URLs on your website.
Importantly, whereas Lighthouse will only ever give you this data for one URL at a time, Sitebulb will collate the issues so you can identify groups of URLs that have the same problems - and then dig into these groups further to find the worse offenders.
As an example, consider the Hint below, which picks out pages that have images which could use further optimization:
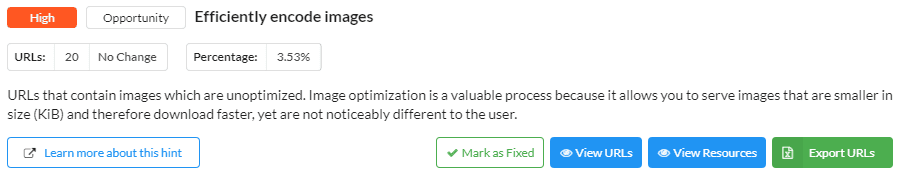
If I click 'View URLs', I can see the URLs which contain images that need further optimization:
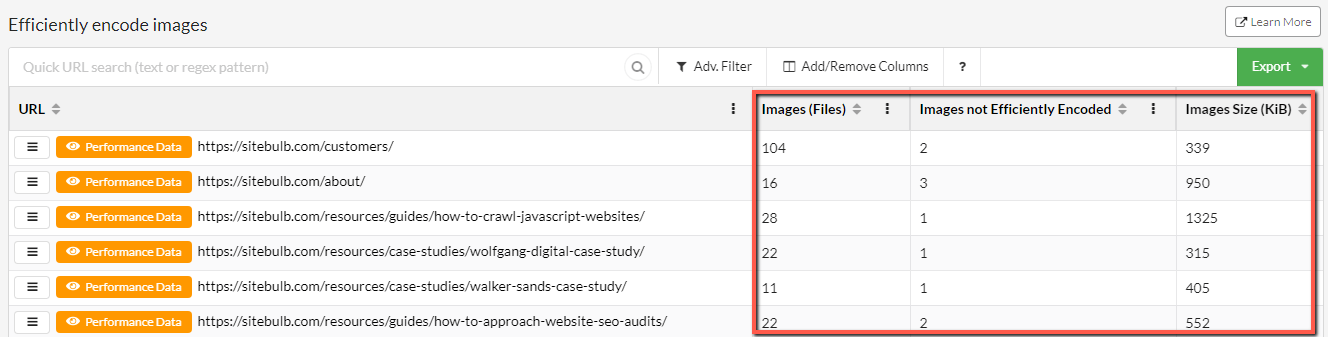
The data columns highlighted above help you understand the scale of the issue on each URLs, so you can determine if you want to explore further. For instance, you can sort by the column 'Images not Efficiently Encoded' in order to highlight the worst offenders.
The other blue button, 'View Resources' shows the image files themselves which need further optimization:
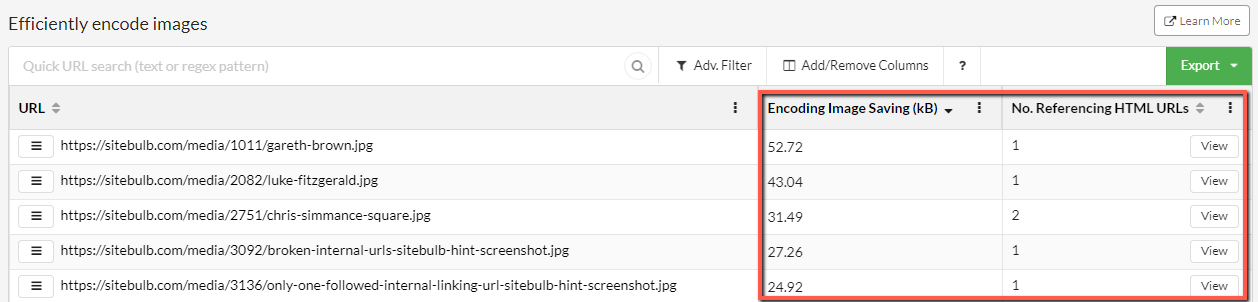
This time, the highlighted columns tell you data regarding the specific image URLs themselves. This allows you to sort either by the images which will benefit most from optimization (the column 'Encoding Image Saving' shows you this) or by the images which are most prevalent across the site (the column 'No. Referencing HTML URLs' shows you this).
Performance budgets
We held a Core Web Vitals webinar with expert guests Arnout Hellemans and Billie Geena. Try as we might, we could not get Arnout to shut up about the value of utilising performance budgets.
If you've watched that and Arnout failed to convince you, I have also written some performance budgets documentation where I explain what they are and how to use them. So if you find the following a rather brief description, it is not about me being a lazy prick, and more about me trying not to write 5000 words of drivel once again.
The performance budget data is, somewhat surprisingly, located under the Performance Budget tab.
Scrolling down you will see a performance budgets chart:
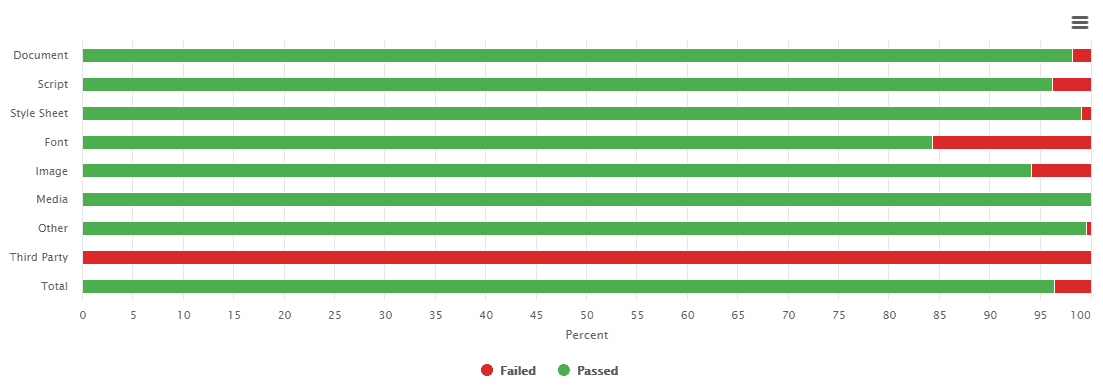
And then underneath that, the same data in table format:
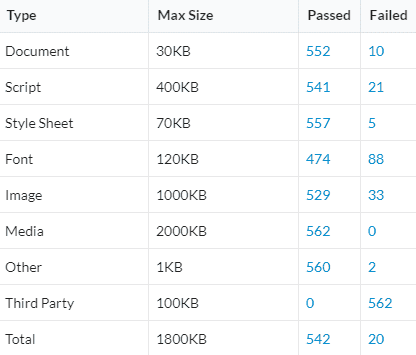
The first column shows the type of page resource, and the second column shows the maximum 'allowed' size of all the corresponding resources on each URL. So for example looking at the second row, there is an allowed budget of 400KB for scripts. Of all the URLs on the website, 541 were under this 400KB budget (i.e. 'passed') and 21 where over the 400KB budget (i.e. 'failed').
Now, you may be wondering at what point you are expected to give a shit about any of this, and I'll point you to the 5th row down: Images.
It doesn't matter how much important 'CWV' work you do, it just takes one intern one moment to upload one full size 5MB photo and the page is totally fucked.
I don't care if you ignore every word Arnout ever says, or print my article out to use as kindling, just make sure you check the images section of the performance budgets, which will identify any URLs with images that have a large total weight.
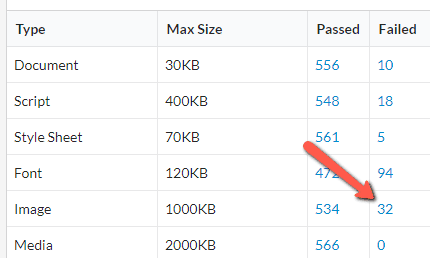
Let's click this '32' value to see the pages on the Sitebulb site with high image weight...
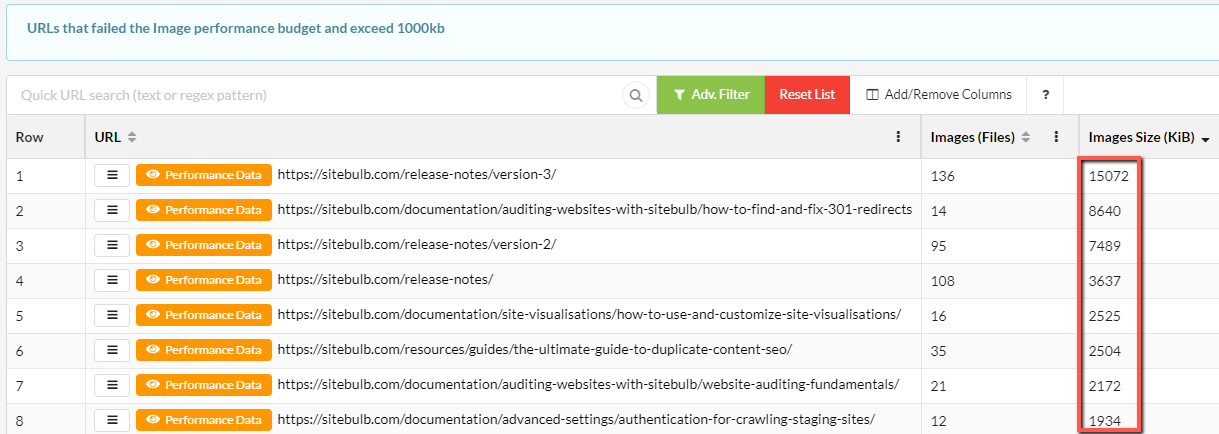
Look at the fucking state of those release notes pages!
I'll be honest, there's loads more shit I could tell you about the performance stuff, but you've put up with way too much serious shit already, so I'll just point you at the docs instead if you wish to read further:
- How to audit performance & Web Vitals
- Performance budgets (what they are and how to use them)
- URL sampling (how and why we do it)
New audit setup process
I know what you're thinking, "You fucking charlatan, this isn't a new feature it's just a different way to do the same bastard thing!"
And while I struggle to dispute this assertion, there are a couple of neat features the new setup allows.
The first is that you can now set the device type in the project setup - desktop or mobile - with mobile being the default (mobile first innit):
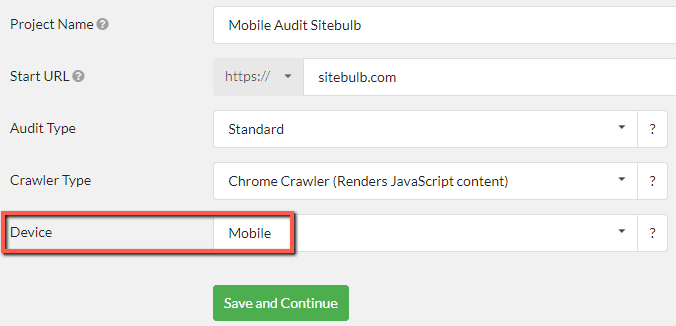
The second is that the audit options are now completely decoupled, which means you can pick and choose exactly which audit options you want, without being obliged to fill up your hard drive with needless data.
So you can do this sort of thing:
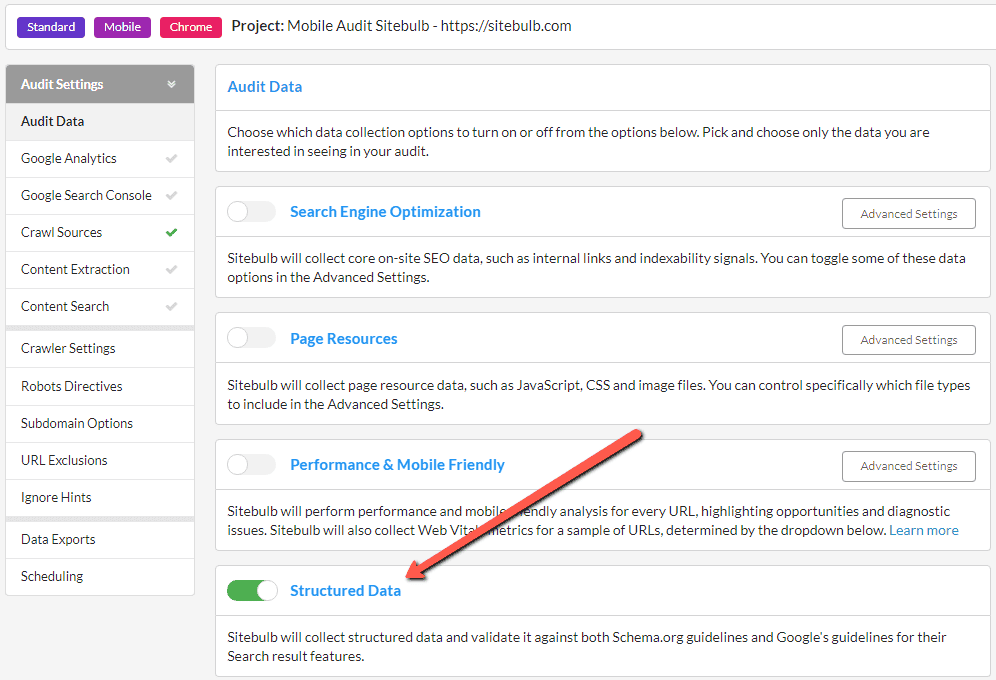
i.e. only collect structured data, without the SEO data which was always on before (on page, links, indexability signals, duplicate content etc...).
This means you can do really specific audits, a lot more quickly and efficiently (think about content extraction on a competitor site just to steal their price data - but you don't give a shit about their SEO or security data... switch on content extraction and turn everything else off).
Open audits in new windows
If you've ever spent your weekends comparing Sitebulb audits (don't pretend like you haven't), you'll have found this task pretty frustrating... before now.
Ctrl+click (Cmd+click on Mac) to open up audits in a new window overlay:
But don't stop with only one! You can keep opening and opening more audits, until you can't see the wood for the audits.
Single Page Analysis given more of the limelight
We've provided a 'single page analysis' tool in Sitebulb for literally years, and almost nobody knew about it. Frankly, we were getting pissed off how often we'd point it out and folks would think we added a new feature. Literally years!!
So we just moved it out of the 'Tools' dropdown menu at the top (emphasising arrows mine).
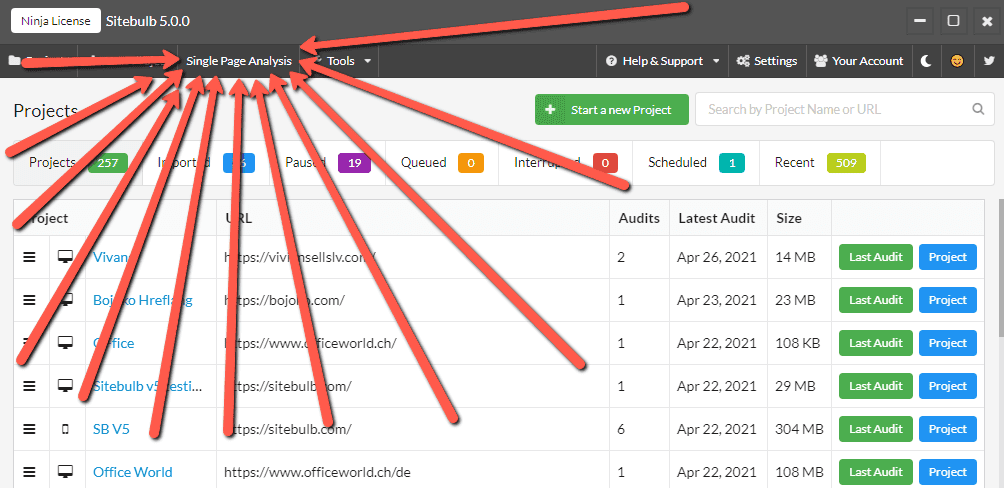
If you haven't yet tried the tool, maybe this it's about time you should.
We have also now made it available in URL Lists via the (right click) context menu. If you hit 'Single Page Analysis' from here it will open up a new window and run a 'live' Single Page Analysis on the URL in question.
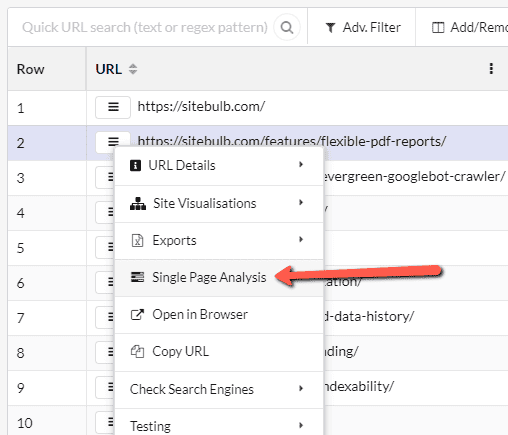
Here's what that looks like:
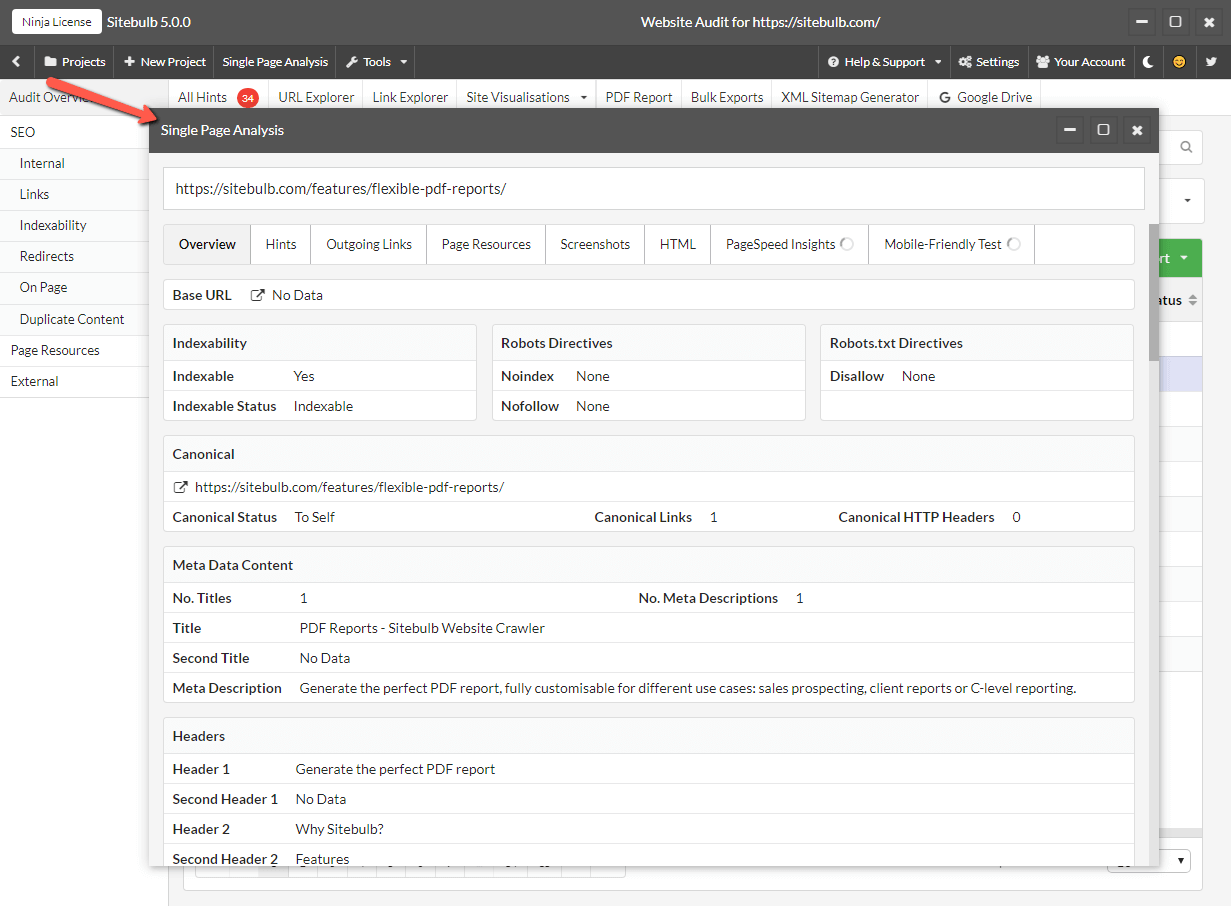
Note that this is NOT data collected during the audit. This is Sitebulb rendering the page, parsing the HTML and compiling the data live. So if you need to verify an issue has been resolved, this is a great, quick way to do it.
Re-audit without pre-audit
Although some may prefer the flashy features above, this one is my favourite. If you want to re-audit a website using exactly the same configuration as your last audit, you can easily do this now using the dropdown option 'Start with current configuration.'
This skips the pre-audit, and will just start the new audit up instantly. Sooooo much more convenient.
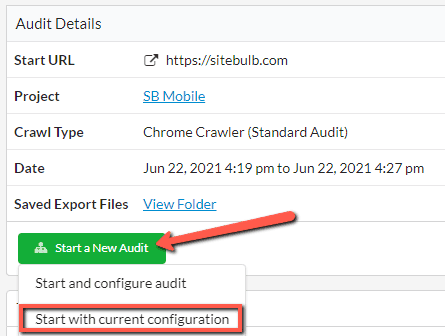
487 Bugs Fixed
We have fixed so many shitty little bugs in this version I actually don't even want to count them, never mind write about them. Especially when you lot will not even give one single fuck about any of them. Also the Belgium - Portugal game is just hotting up...
...so I won't bother. But I will email you individually if you reported a bug we fixed (at some point later today or tomorrow).
Archives
Access the archives of Sitebulb's Release Notes, to explore the development of this precocious young upstart:
- The Beta Notes (January-September 2017)
- Version 1 (September 2017 - March 2018)
- Version 2 (April 2018 - May 2019)
- Version 3 (October 2019 - July 2020)
- Version 4 (August 2020 - June 2021)