


UX for Technical SEO: Optimizing Core Web Vitals & Mobile-First Indexing
 Nazanin Teymoori
Published October 3, 2025
This week, we’re grateful to Nazanin Teymoori, who dives into the multitude of ways that UX and SEO are deeply connected. Please be aware that this article has been translated into English from its original Persian.
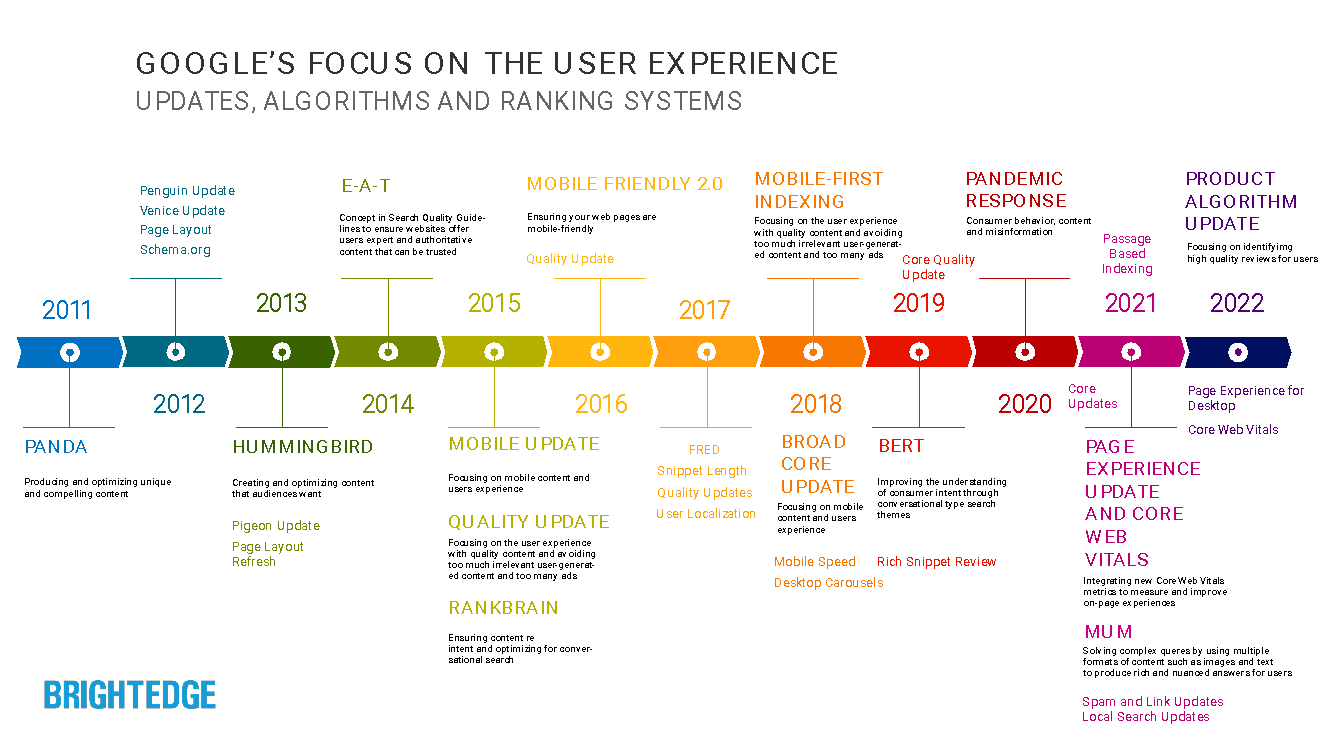
User experience (UX) has become one of the most influential factors in modern SEO. As Google continues to refine its algorithms, ranking signals increasingly prioritize how people interact with websites rather than just how well pages are optimized for keywords. From the early focus on unique content in the Panda update to today’s emphasis on Core Web Vitals and Page Experience, the message is clear: a site that serves its users well will also perform better in search.
This article explores the deep connection between UX and SEO, breaking down the practical ways in which design, performance, and accessibility impact rankings. You’ll discover why factors like page speed, mobile-first indexing, site architecture, and accessibility matter not only for users but also for search visibility. With step-by-step explanations, real-world examples, and insights into tools like Sitebulb, this guide shows how optimizing for user experience directly translates into stronger SEO performance.
Contents:
What is UX, and why does Google focus on it?
User Experience (UX) refers to the journey users undergo when interacting with a product, influencing their satisfaction. Over the years, Google has refined its algorithms to prioritize user needs and happiness. These changes indicate that UX is now vital for rankings, notably following the Panda algorithm’s emphasis on unique content and the introduction of Mobile-First Indexing in 2017, as well as recent updates such as Core Web Vitals and Page Experience, which emphasize both technical metrics and user experience.
The Role of UX in SEO
User Experience (UX) is crucial for enhancing SEO. By offering a straightforward way to access information and quality content, UX improves user interactions and boosts the site's credibility in Google's view.
1. Page Load Speed:
Page load speed is key to user experience and site rankings. Faster loading times directly correlate with better user retention and conversion rates.
2. Mobile-First Indexing:
Google primarily focuses on the mobile version of websites for ranking. Key considerations for mobile version design include:
Creating a responsive website
Allowing crawlers to access resources, ensuring they are available to Google’s crawlers
Ensuring content consistency between desktop and mobile versions (though this may not apply in all cases)
Using structured data such as Product, Video, Breadcrumb, etc.
Using consistent metadata

3. Functional and Aesthetic UX Design:
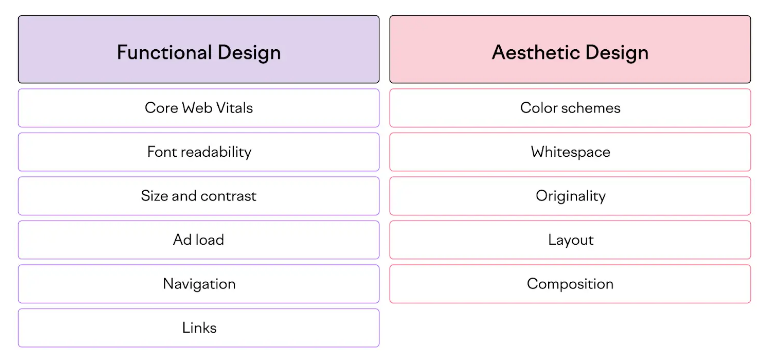
UX design for SEO purposes is divided into two sections:
Functional Design covers Core Web Vitals, font readability, color contrast, and navigation.
Aesthetic Design includes color combinations, spacing, layout, and design alignment with the brand's identity.
These principles can influence metrics such as Time on Page, Returning Traffic, and Brand Searches.
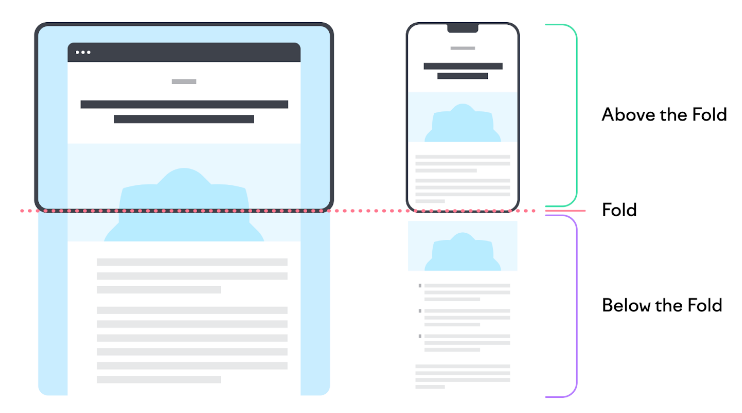
4.Importance of Above the Fold(ATF):
Users' initial view of a site (without scrolling) is critical. You can improve this viewport section by:
Implementing responsive design
Optimizing the header, which includes the menu, logo, and login/signup links
Enhancing search functionality with features like placeholder text and auto-complete
5. Site Architecture:
Site architecture refers to the structure and organization of website pages, content, and links. It enables users and search engines to access information easily and enhances the user experience.
Best practices for implementing site architecture:
Use a proper site structure, such as a hierarchy, flat, or nested
Utilize pillar and topic clustering with internal linking
Organize content using categories and tags
Optimize URLs and create a simple navigation menu
Use breadcrumbs to assist both users and search engines
Best tools for analyzing website architecture:
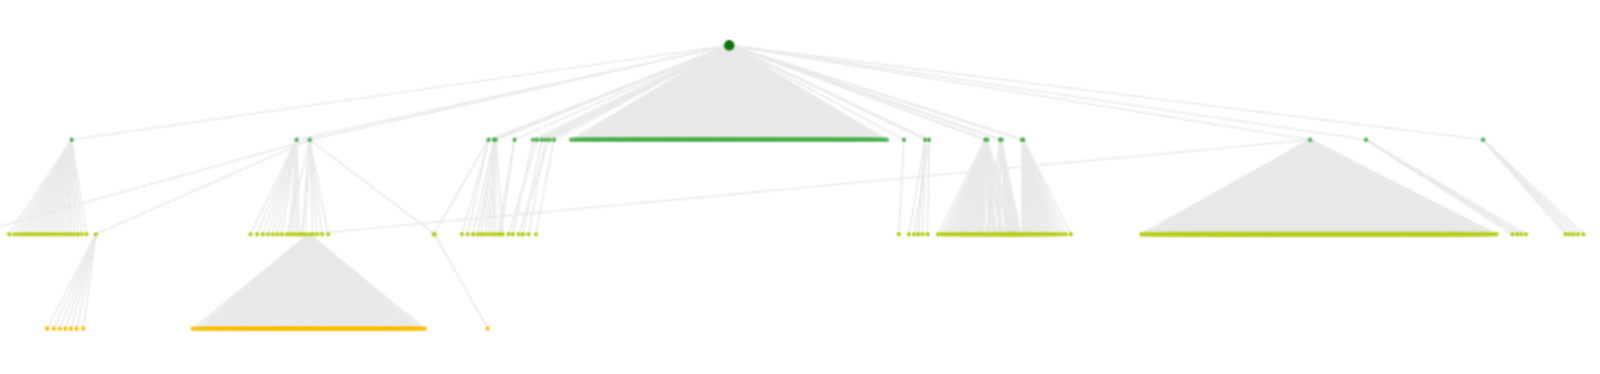
Screaming Frog Logfile analyzer, Tree Graph, and Force-Directed Diagrams
Ahrefs Site Structure
Sitebulb Directory Tree (pictured below)
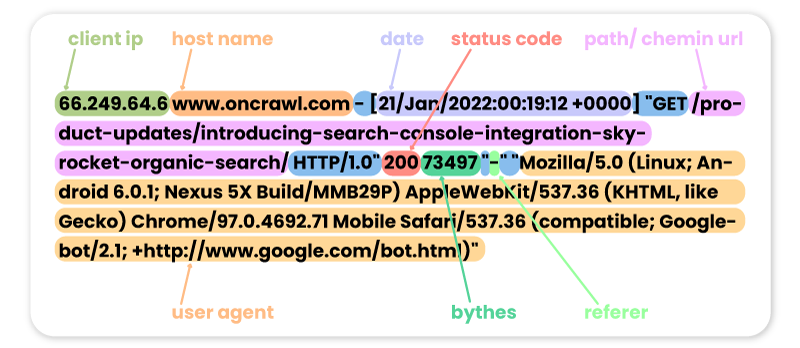
Note: Log files are text files that automatically record events on a web server. They contain crucial information about server activities and interactions between users or bots and the website. Log files aid in managing crawl budgets, diagnosing and fixing access errors, and identifying unnecessary JS and CSS resources. The information within log files includes the requested IP address, user agent, timestamp, server response status, and more.
6. Accessibility in UX Design and Its Importance for SEO:
Ensuring accessibility in UX design makes content usable and accessible for all users, including those with disabilities. Google has criteria for evaluating website accessibility, and websites that adhere to accessibility guidelines typically rank higher in search results.
Key accessibility improvement guidelines:
Creating user personas
Designing for all devices and platforms
Using accessible fonts and appropriate color contrast
Adding alternative text (Alt-Text) and meaningful anchor text
Providing subtitles for videos and using proper HTML tags (like title and list tags)
Avoiding excessive animations
Ensuring compatibility with screen readers
Adding keyboard shortcuts and accessible navigation
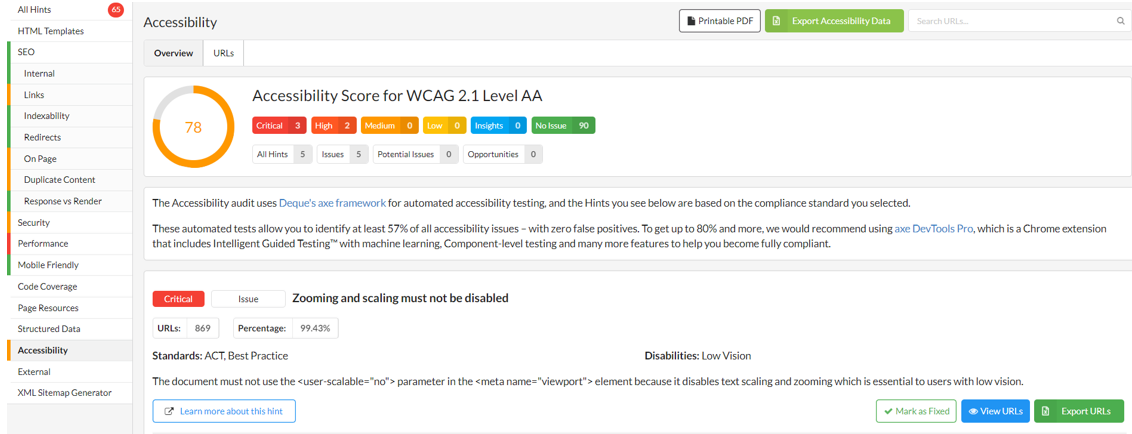
Accessibility is a crucial factor in Google rankings. To optimize this, we can click on the Accessibility tab in the Sitebulb tool on the left and check all the issues that are causing the score for this factor to drop on the site, then fix them.
For example, in the image below, we can see that there are 3 critical errors and 2 high errors, with the rest having lower priority. By clicking on each one, we can access the important issues that will help improve the site's accessibility score.
What is Google Page Experience? How to Optimize Google Page Experience?
Google's Page Experience update significantly impacted websites that offered a subpar user experience. This update relies on signals indicating the quality of user interactions with a webpage.
Key Signals of Google Page Experience
Core Web Vitals
Mobile-Friendly and Responsive Design
HTTPS: Using an SSL certificate is essential for securing user data.
No Intrusive Interstitials: Disruptive pop-ups negatively affect user experience and rankings.
Safe Browsing: The site must be free of malware and harmful content.
The rest of this article focuses on optimizing Core Web Vitals factors.
What Are Core Web Vitals?
Core Web Vitals consists of essential metrics that assess user experience through interaction, performance, and visual stability. These metrics enable Google to identify and prioritize websites that provide a superior user experience.
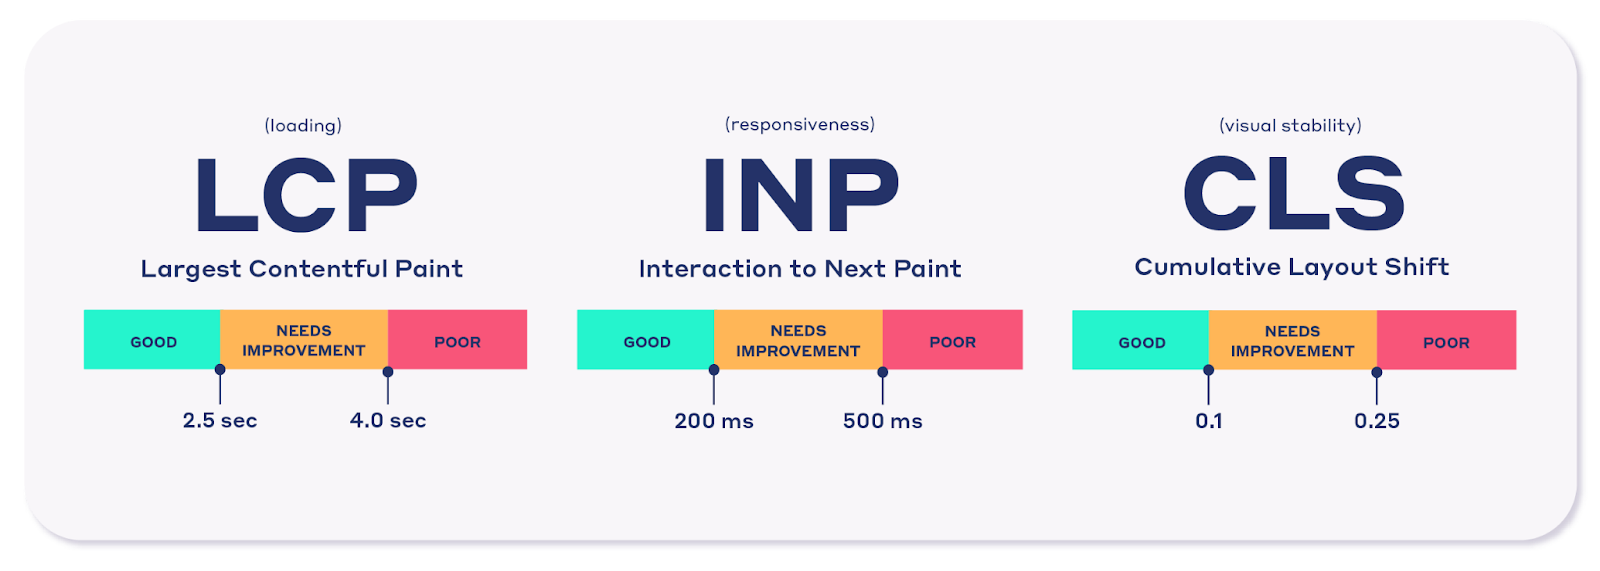
The primary Core Web Vitals metrics include:
LCP (Largest Contentful Paint) – Measures loading performance.
INP (Interaction to Next Paint) – Evaluates responsiveness.
CLS (Cumulative Layout Shift) – Assesses visual stability.
Tools for Measuring Core Web Vitals
Two types of data are utilized to analyze and optimize Core Web Vitals. Each type of data is gathered through different tools and serves specific purposes.

Lab Data
Lab data is collected in a controlled environment, such as predefined device and network settings. This data type is generated in real-time with tools designed to simulate specific conditions.
Tools for collecting lab data:
Chrome DevTools
Lighthouse
WebPageTest
Field Data
Field data is collected from actual users and their interactions with your website. This data reflects real-world user experiences across diverse conditions (e.g., varying devices and network speeds).
Tools for collecting field data:
CRUX Report (Chrome User Experience Report)
Core Web Vitals Report in Google Search Console
PageSpeed Insights
Real User Monitoring (RUM) tools such as Uptime, Retrace, and Pingdom
What is LCP? (Largest Contentful Paint)
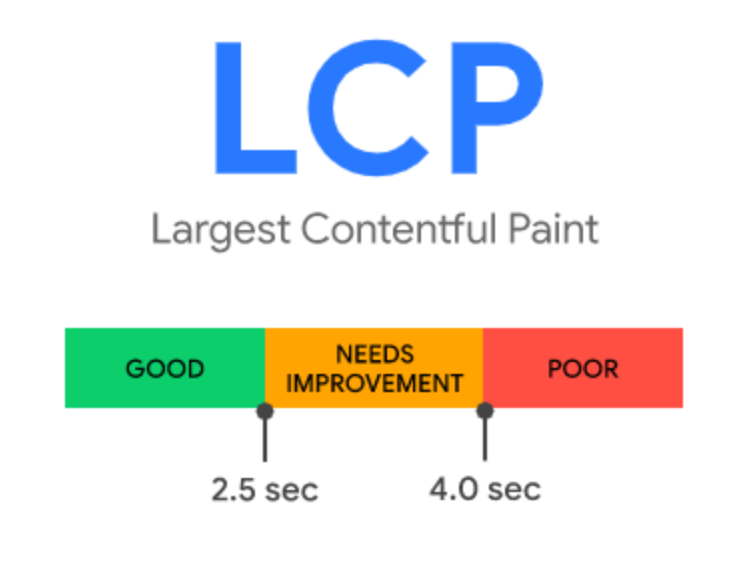
Largest Contentful Paint (LCP) is one of Google’s Core Web Vitals that measures how quickly the main, visible part of a page loads. In practice, it tracks how long it takes for the largest visual element in the browser window — whether that’s an image, a block of text, or a video — to appear. Google considers this important because users tend to perceive the page as “ready” once that primary content is on screen.
According to Google’s documentation, an LCP under 2.5 seconds is rated “good,” between 2.5-4 seconds “needs improvement,” and anything slower than 4 seconds is considered “poor.”
Not every item on a page is factored in. The LCP metric focuses on the largest elements actually visible in the viewport, such as:
Images (<img> tags)
Vector graphics embedded inside <svg>
<video> elements
Background images set via CSS url()
Large text blocks within block-level elements

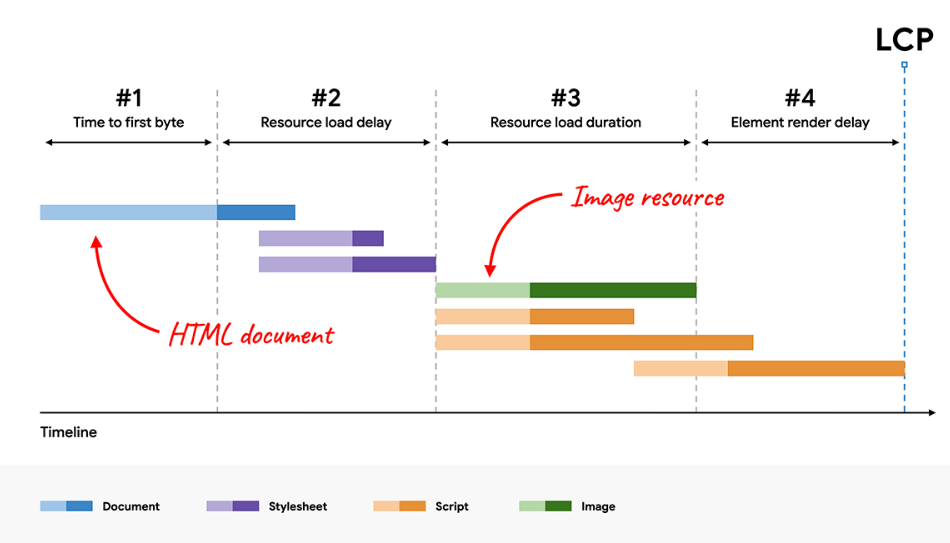
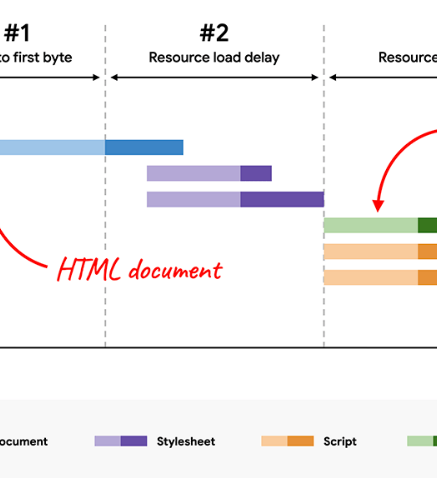
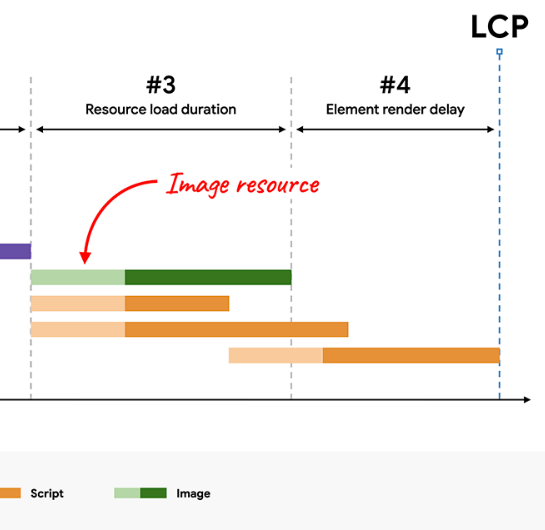
LCP Sub-Parts
Instead of thinking of LCP as a single timer, it helps to break it down:
Server response time (TTFB): how quickly the server replies
Resource load delays: waiting for assets like images or fonts to begin loading
Resource load duration: how long it takes for those assets to finish downloading
Render delay: time taken for the browser to actually paint the element on screen
Understanding these elements aids in accurately identifying issues and optimizing performance.
What is TTFB (Time to First Byte)?
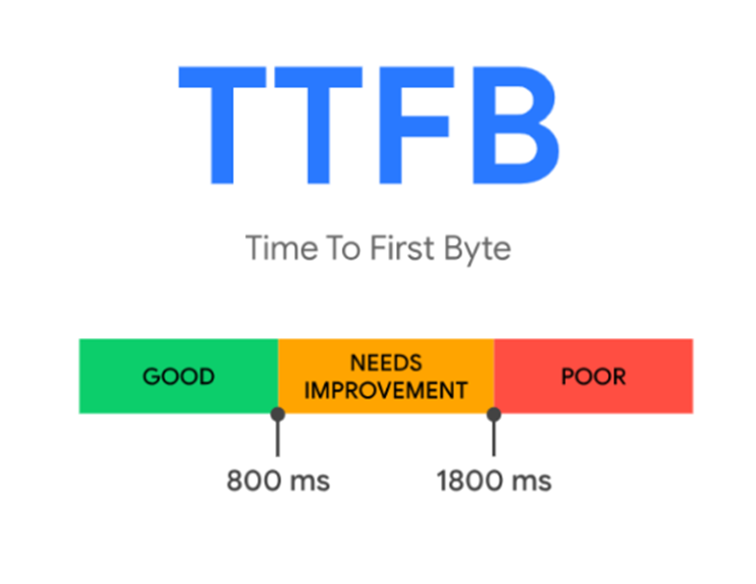
Time to First Byte (TTFB) measures the round trip from a user’s browser making a request to the moment it receives the very first byte back from the server. Put simply, it’s a proxy for server responsiveness.
Google’s own benchmarks suggest that under 800 ms is “good,” between 800–1800 ms needs work, and anything slower than 1800 ms is problematic (source).
Factors that influence TTFB include:
Redirect chains (each extra hop adds latency)
Slow DNS lookups
TLS handshakes for HTTPS
Database queries or heavy server-side logic before a response is generated
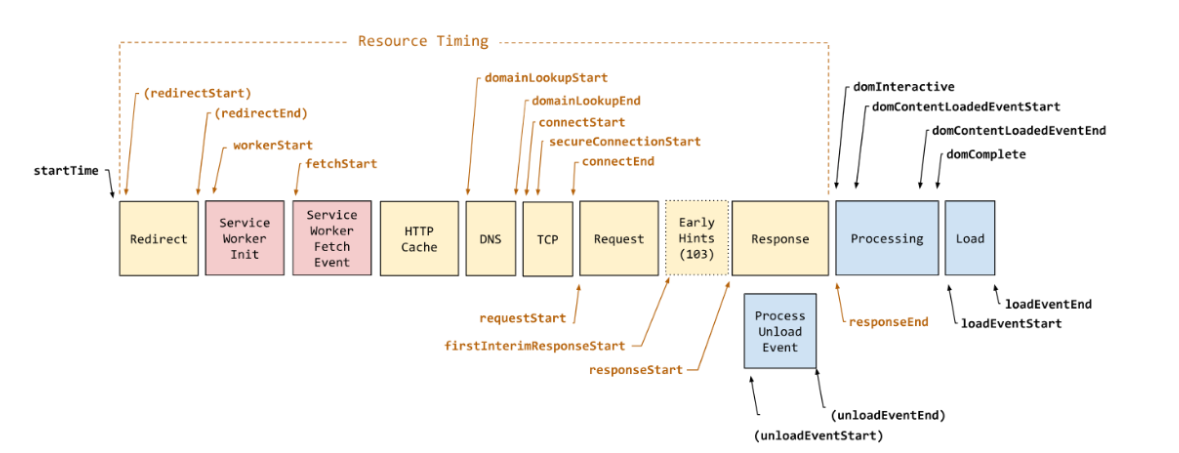
Components of TTFB
Below, we will explore the key components of TTFB:
Redirect Time: The duration spent on page redirects. Unnecessary redirects can increase TTFB.
Service Worker Startup Time: The time required to initiate a Service Worker (if used) to manage requests before they reach the server.
DNS Lookup: The time taken to resolve the server's IP address. This step can take longer if DNS caching is not employed.
Connection and TLS Negotiation: The time needed to establish a connection between the browser and the server, including the TLS handshake for a secure connection. Enabling HTTPS may increase this time, but using HSTS can help mitigate the delay.
Request: The time it takes for the browser to send a request to the server.
Response: The server's duration in sending the first byte of its response is often influenced by database performance and server configurations.
Detection and Analysis of Backend Task Performance Metrics
To optimize TTFB and identify server-side issues, the following tools and techniques can be used to analyze and enhance backend performance:
Using the Server-Timing Response Header: By implementing this header on the backend, it is possible to measure the time spent on various server tasks, including:
Database Read/Write: The time spent retrieving and storing data in the database.
CPU Time: The time required for processing tasks by the server’s CPU.
File System Access: The time taken to access system files.
Utilizing Application Performance Management (APM) Tools: APM tools monitor real-time server performance.
These insights help identify server bottlenecks, enabling optimizations to improve response times and efficiency.
Common Causes of Slow TTFB
Several factors can contribute to slow TTFB, which affects website performance. Below are the key causes that can hinder server response times and negatively impact user experience:
Poor server performance
Excessive redirects
Lack of a Content Delivery Network (CDN)
Heavy database queries and data retrieval
How to Optimize TTFB? Strategies to Optimize TTFB
To optimize Time to First Byte (TTFB), it is essential to identify the factors affecting page load speed and improve them accordingly. The key strategies for optimizing this metric include:
High-quality hosting and choosing the right platform for the website
Using edge servers and a CDN for users far from the main server
Implementing HTTP headers in Cache-Control for caching parts of the page, where applicable
Eliminating redirect chains Let’s briefly explain the types of redirects:
Same-origin redirects occur when a redirect is made from one URL to another within the same domain or website. These redirects typically do not cause significant performance issues, as they use the same domain resources and do not create security conflicts.
Cross-origin redirects happen when a redirect points to a completely different domain from the original one. This type of redirect can introduce security risks or unnecessary delays.
Implementing the HSTS security header: Using HTTP Strict Transport Security (HSTS) ensures that the browser enforces HTTPS from the first connection, eliminating the need for redirects.
Utilizing Stream Markup: This technique allows different sections of an HTML page to load simultaneously instead of waiting for the entire page to load before displaying content. This significantly speeds up page rendering.
Leveraging Service Workers: Service Workers act as a proxy between the browser and the server, allowing essential resources to be cached in advance. This reduces the need to fetch resources repeatedly, improving load times.
Using Early Hints (103): This HTTP status code triggers resource preloading in responses, allowing the browser to load critical assets before receiving them. This reduces the reaction, reducing the overall page load time.
Optimizing TTFB directly enhances key performance metrics such as LCP (Largest Contentful Paint), leading to faster page loads, improved user engagement, and better search engine rankings.
Eliminate Resource Load Delay
This delay refers to the time the browser waits to load and display critical resources such as images, styles, or fonts. To optimize this time, the following actions can be taken:
Use the srcset and src attributes in the tag. These attributes help load images optimally based on screen size and page requirements.
Preload background images in CSS using
Preload text elements used for LCP with
Use the fetch priority attribute in the tag.
Carefully deprioritize specific resources.
Use font-display: swap in CSS.
Avoid heavy scripts that block the quick loading of LCP elements.
Reduce Resource Load Duration
The time needed to load an LCP resource directly impacts page speed and user experience. The following strategies can help reduce resource loading time:
For images, use the appropriate dimensions, formats, and compression.
For text-based LCP elements, opt for the WOFF or WOFF2.0 format with compression.
Utilize a nearby server or a CDN to minimize load times.
Apply fetch priority for efficient loading of the LCP resource.
Decrease network latency by leveraging caching techniques.
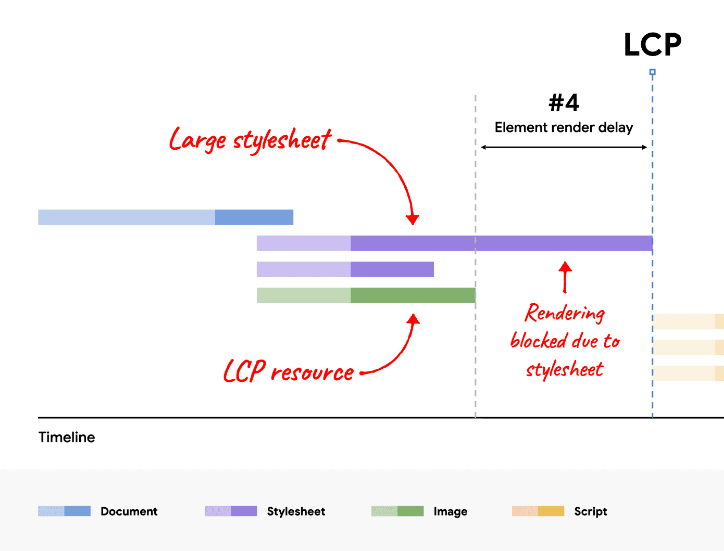
Eliminate Element Render Delay
The rendering phase of LCP elements begins immediately after the resource is loaded. During this phase, the browser adds the LCP resource to the DOM and renders it. However, if blocking resources, such as stylesheets or JavaScript files, are present, this process may be delayed.
The following optimization techniques help prevent this issue:
Prevent full-page rendering blockages caused by simultaneous loading of stylesheets and scripts in the section.
Ensure the LCP resource is fully loaded before adding it to the DOM (avoid waiting for JavaScript execution).
Avoid main-thread blocking, which causes delays in processing tasks.
Reduce blocking stylesheets or inline critical styles to prevent LCP delays.
Remove or defer unused CSS and JS files (Coverage) and minify large CSS files.
Leverage SSR (Server-Side Rendering) and SSG (Static Site Generation). Delays in rendering LCP elements directly impact page load time and user experience.
Reducing the main-thread load and optimizing CSS and JS resources can accelerate the rendering process, ultimately improving the LCP metric.
For example, in t he Sitebulb tool, after auditing the website, you can see the following tabs under Performance, which analyze performance metrics like LCP and CLS.
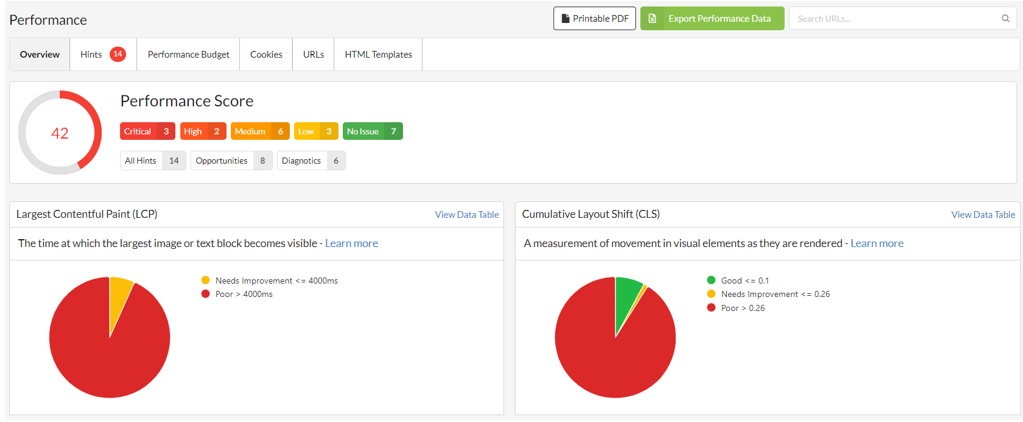
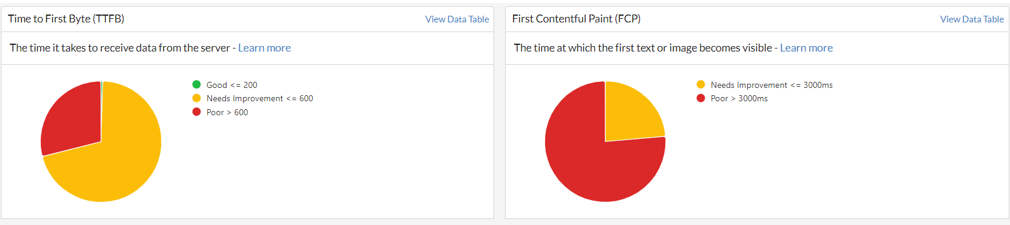
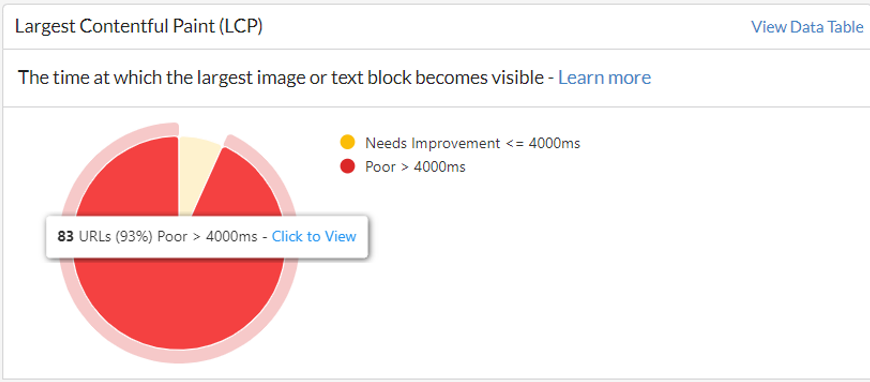
By selecting the red section on the circle, you can view all the URLs that have LCP issues.
On this page, by clicking the Performance Data button, you allow yourself to view areas that require improvement.
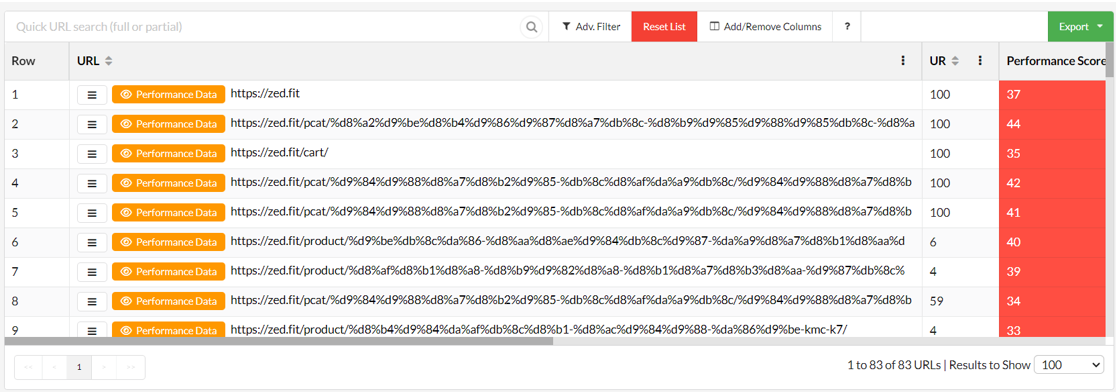
I n the image below, you can view the performance data for the selected URL at the top of the page (under the Web Vitals section). In the second section (Performance Budget), the documents used on this page, along with their specifications, are listed.
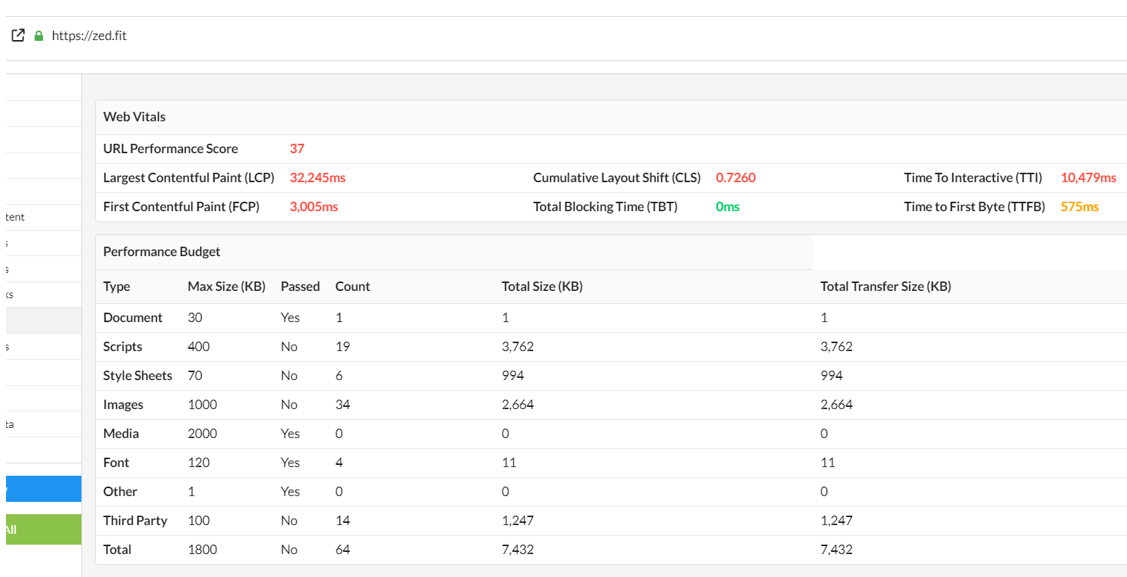
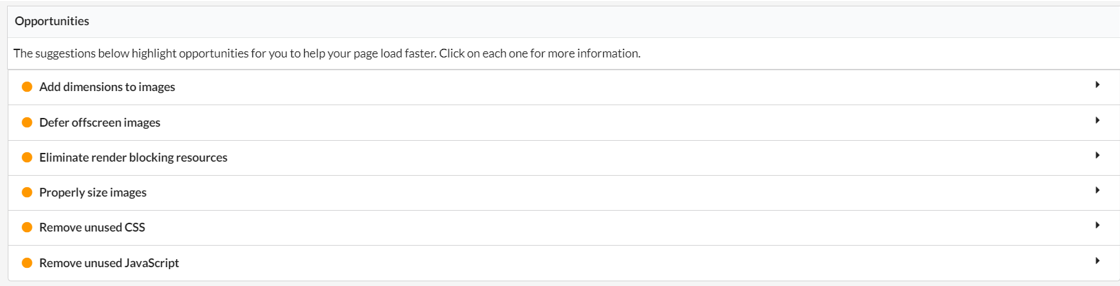
In the third section (Opportunities), you will see suggestions for improving metric scores. All the optimization solutions for different sections are explained above.
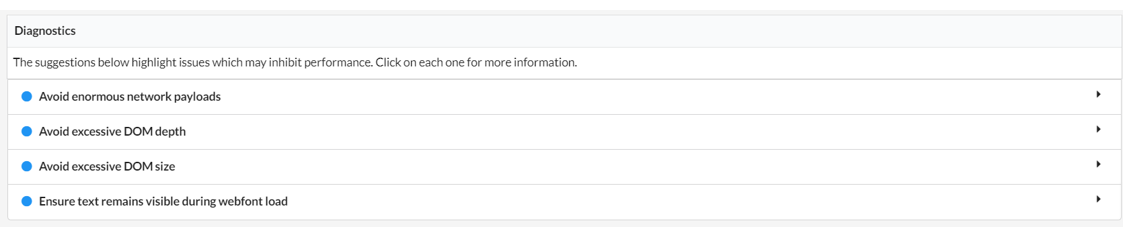
In the fourth section (Diagnostics), any issues that may affect performance are displayed, and by clicking on each, we can view the URLs and resources that are experiencing these problems.
To check and optimize the mobile-friendliness of the site, you can select the Mobile Friendly option on the left and enter the page below.
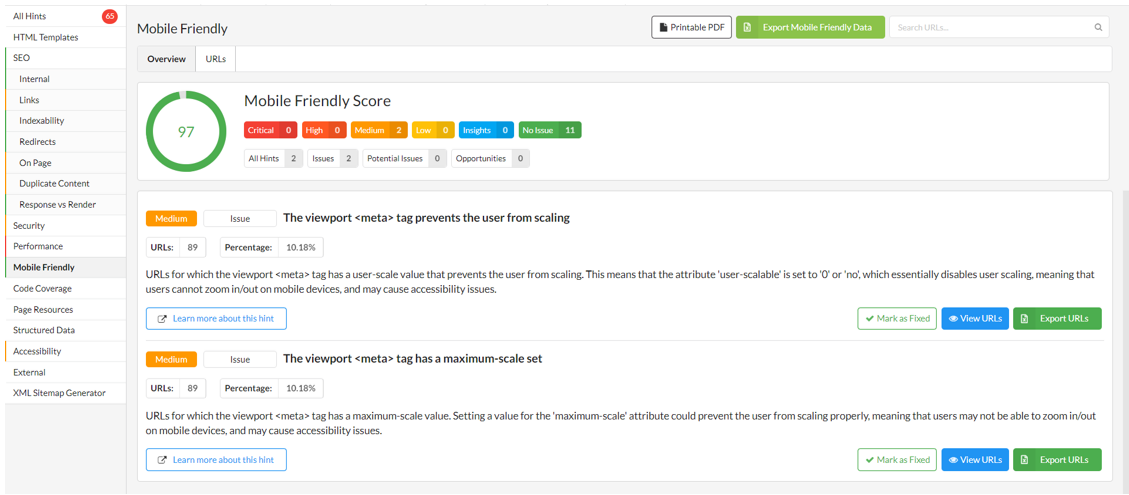
As shown in the image above, the factors that contribute to a low Mobile Friendly score are highlighted.
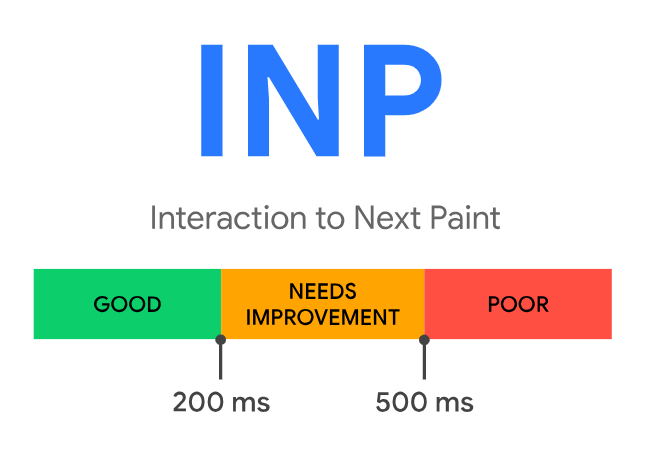
What is INP (Interaction to Next Paint)?
Interaction to Next Paint (INP) is a newer Core Web Vital replacing First Input Delay. Instead of only looking at the first interaction, INP considers all clicks, taps, and key presses on a page and records the longest delay before the screen updates. That makes it a more complete measure of responsiveness.
Benchmarks from web.dev classify results as:
Good: under 200 ms
Needs improvement: 200–500 ms
Poor: over 500 ms
Note: actions like scrolling and zooming aren’t counted. The focus is on discrete input events that expect a visible reaction.
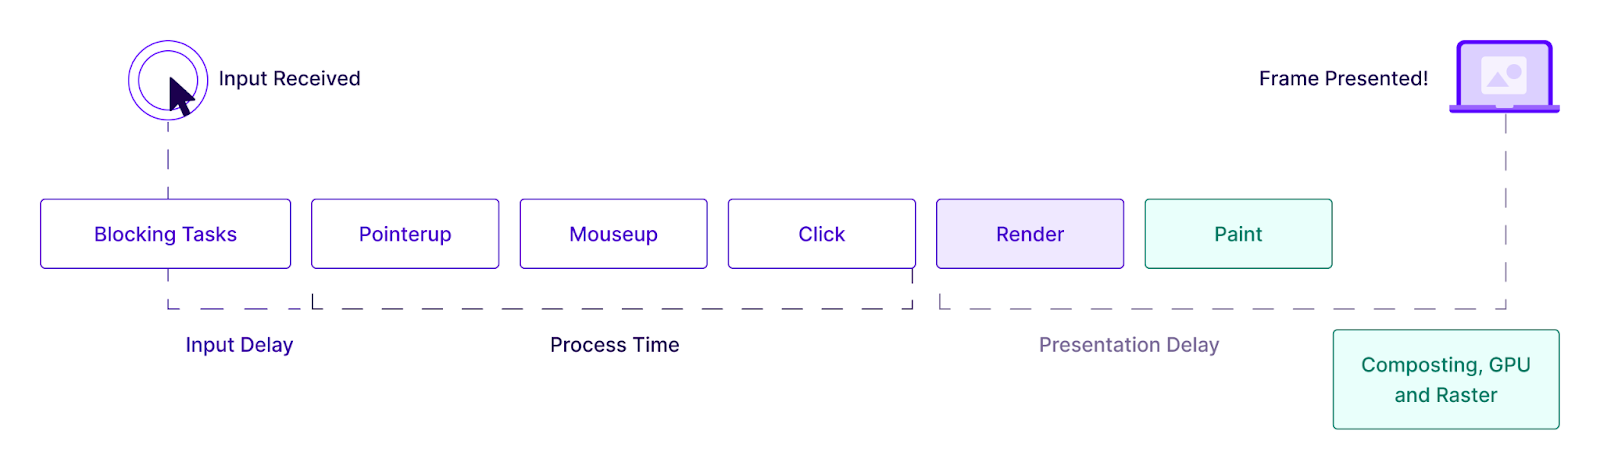
What are the Phases of Interactions?
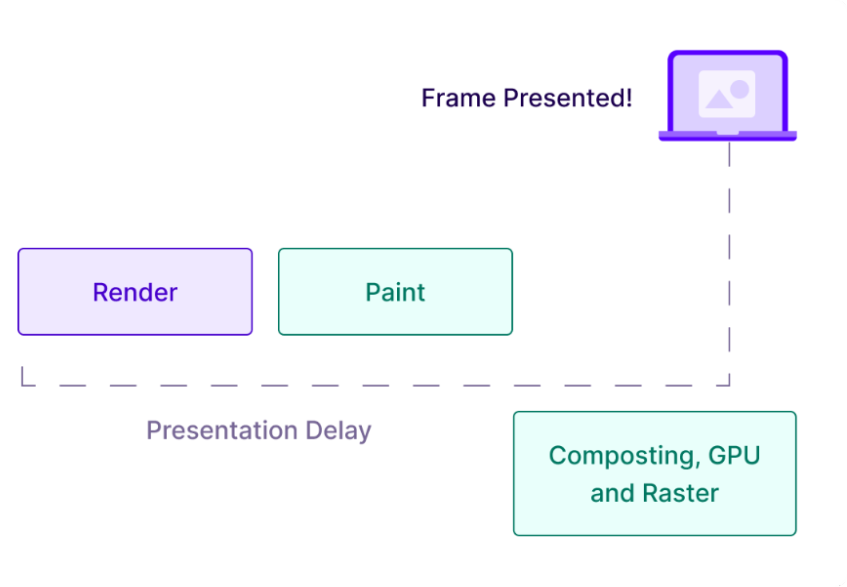
Below, we will explore the key phases of interactions: Input Delay, Processing Duration, and Presentation Delay.
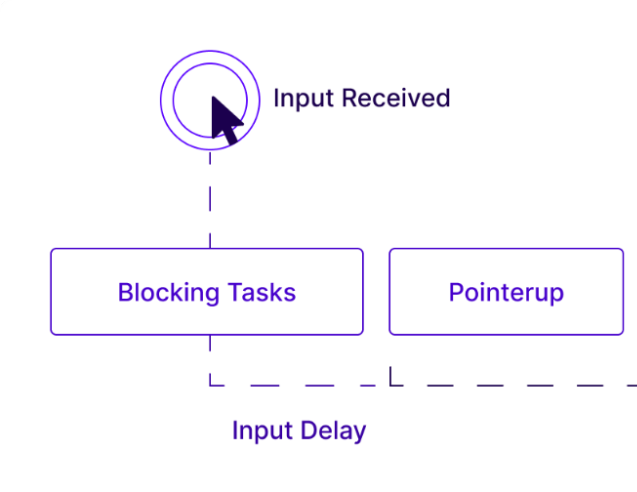
Input Delay: The time from receiving user input (such as a click or touch) to the initial processing on the Main thread.
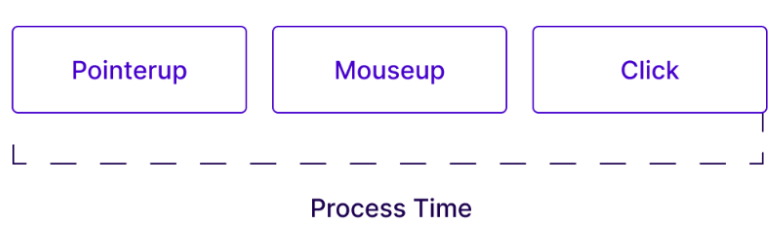
Processing Duration: The time the browser spends processing the user's request, including executing JavaScript, performing calculations, and other tasks.
Presentation Delay: The time elapsed between completing the processing and displaying the result to the user (such as rendering an element or updating the page).
Identifying and Reducing Input Delay
Input delay refers to the time between receiving user input (such as clicks or typing) and the system's response. This delay can negatively impact the user experience and erode trust in the site's performance. Causes include device speed, network quality, and the complexity of the site code.
Optimizations aim to identify and reduce these delays to enhance responsiveness. Here are some strategies to reduce input delay:
Avoiding Recurring Timers: Functions like setTimeout and setInterval can increase processing load and disrupt input events. Use these only when necessary.
Avoiding Long Tasks and Converting Them to Shorter Tasks: Long tasks block the interface. Break them into shorter tasks to keep the UI responsive.
Preventing Interaction Overlap: Multiple running processes can interfere with each other. To prevent this, utilize debouncing (to delay similar operations) or AbortController (to cancel running requests).
Avoiding Heavy Animations: Complex animations increase delay. To reduce processing, opt for CSS animations instead of JavaScript animations.
Using Non-Composited Animations: Non-composited animations don’t run on the main thread, which reduces processing load and response times.
Avoiding Janky Animations: Lagging animations diminish the user experience and impact cumulative layout shifts (CLS). Ensure animations are efficient and well-optimized.
Minimizing CPU Processing on the Main Thread by Reviewing TBT: Excessive main-thread processing affects input delay. Lessen load by dividing tasks and reviewing TBT to improve response time.
Optimizing Processing Time or Event Callbacks
This process minimizes the time needed to handle events (clicks, typing, scrolling) and operations such as JS and CSS processing. Concurrent events or callbacks can hinder performance and diminish user experience. Here are methods for optimizing processing time:
Preventing Unnecessary Callbacks: Callbacks run in response to events, and excessive executions can harm performance. Use Throttle to restrict invocations within a specific time frame and Debounce to ensure that only the final callback is executed after a delay.
Throttle manages the number of invocations that occur within a specific time frame, which helps to prevent excessive callback execution.
Debounce, conversely, ensures that only the final invocation of a callback is executed after a designated period has passed, effectively reducing unnecessary processing.
Prioritizing Main-Thread Tasks: Prioritize essential tasks on the main thread to minimize delays and enhance responsiveness.
Preventing Reflow and Layout Reconstruction: Excessive DOM changes necessitate recalculating the page structure, which is resource-intensive. Limit DOM changes to mitigate reflow and repaint.
Optimizing DOM Changes and Avoiding Repaint and Reflow: Refrain from making frequent changes to the DOM that impact position, size, or appearance, as these can hinder input processing. Optimize such changes to minimize delays.
Using Web Workers: Implement Web Workers for intensive tasks to offload processing from the main thread, ensuring the UI remains responsive.
Minimizing CPU Processing on the Main Thread: Refrain from performing heavy tasks on the main thread. Reducing Total Blocking Time (TBT) enhances response speed and improves the user experience.
Minimize Presentation Delay
Presentation delays happen when the browser needs extra time to process and display new elements. This delay adversely affects user experience. To improve performance and minimize delay, consider implementing the following optimization methods:
Optimize DOM size: Removing unnecessary nodes and streamlining complex structures can enhance the page's loading and display speed. Implementing strategies like lightweight pages and eliminating superfluous nodes significantly aids this process. Removing extraneous elements from the DOM and utilizing CSS for optimal presentation, with properties such as display: none, enables the removal of unnecessary elements from the page, thereby minimizing loading time without compromising functionality. Also, employing lightweight animations and integrating them with CSS can lessen the processing load.
Use requestAnimationFrame and new technologies: This approach allows the browser to handle animations at optimal moments. The requestAnimationFrame API instructs the browser to perform animations at suitable times for a smoother and more accurate display. Additionally, leveraging new technologies like Web Workers helps to offload heavy tasks from the main thread, optimizing the distribution of processing demands.
Reduce request volume and optimize image size: Reducing the number of requests (such as optimizing images and removing unnecessary requests) can decrease page processing delays. Streamlining images and presenting them in suitable dimensions will lead to quicker page loading.
Optimize page volume for faster loading: In addition to reducing request volume, the page structure must be designed for faster loading. This can be achieved by minimizing the number of heavy resources, like scripts and styles, while also loading non-essential resources simultaneously.
Emphasize displaying above-the-fold content first: If page rendering is slow, consider optimizing the above-the-fold content (the portion visible without scrolling). This strategy allows the next frame to load faster, enabling users to quickly view the main content of the page while the rest loads in the background.
Use debouncing and throttling techniques for user interactions: Debouncing and throttling techniques can improve user interactions involving rapid actions such as typing or consecutive clicks. These methods restrict repeated requests to the system, ensuring they are processed only when needed.
Comprehensive Strategies for INP Optimization
INP optimization is a crucial factor that can greatly influence user experience and web page loading speed. Several strategies exist to minimize input delay and enhance performance in this context.
Resource Load Management
Prioritizing content above the fold
Implementing Lazy Loading for Non-Essential Resources
Implementing Throttling
Increasing Server Efficiency
Implementing browser caching
Using CDN
Database optimization
Using Web Workers
Improving JavaScript Efficiency
Removing unnecessary and unused code
Code splitting for large files
Carefully deferring stylesheets and scripts
Using webpack
Providing Instant Feedback
Using higher-speed scrolling
Using confirmation messages
Sending error messages to users while filling out forms
Using spinners or progress bars
Using the Long Animation Frames (LoAF) API: This API measures the impact of scripts and other processing tasks on rendering performance and animations, reporting which scripts affect rendering delay.
Layout Limitations: Modifications to the layout can significantly affect site performance. These adjustments should be executed with care and optimization in mind.
Using scheduler.yield and navigator.scheduling.isInputPending: these APIs help manage delays in processing inputs and prevent issues with delays. They also determine whether user inputs, such as clicks, typing, or mouse movements, are in the processing queue.
Increasing efficiency with event listeners: An event listener is a function that attaches to an HTML element and executes in response to a specific event (such as clicking, mouse movement, or page loading). Optimizing and minimizing the number of event listeners ensures that only essential events are processed, improving performance.
Key Points for Improving INP
Below, we’ll review these key points for improving INP:
Code execution should occur asynchronously to allow users to receive responses quickly. This method ensures that processes are executed without delay.
When users encounter non-interactive elements, such as images that don't require interaction, these items should be prioritized for loading and processing. Also, the main thread should handle primary processing and heavy tasks.
External scripts and third-party resources can significantly impact performance and processing time; thus, these resources should be managed carefully to avoid adding extra burden to processes.
We must remember that INP is calculated separately for each visit, specifically each time a user loads your page. This means the user experience can vary with each visit, depending on factors like internet speed or the user's device.
What is Total Blocking Time (TBT)?
Total Blocking Time is when the thread handles new inputs but cannot respond to user requests.
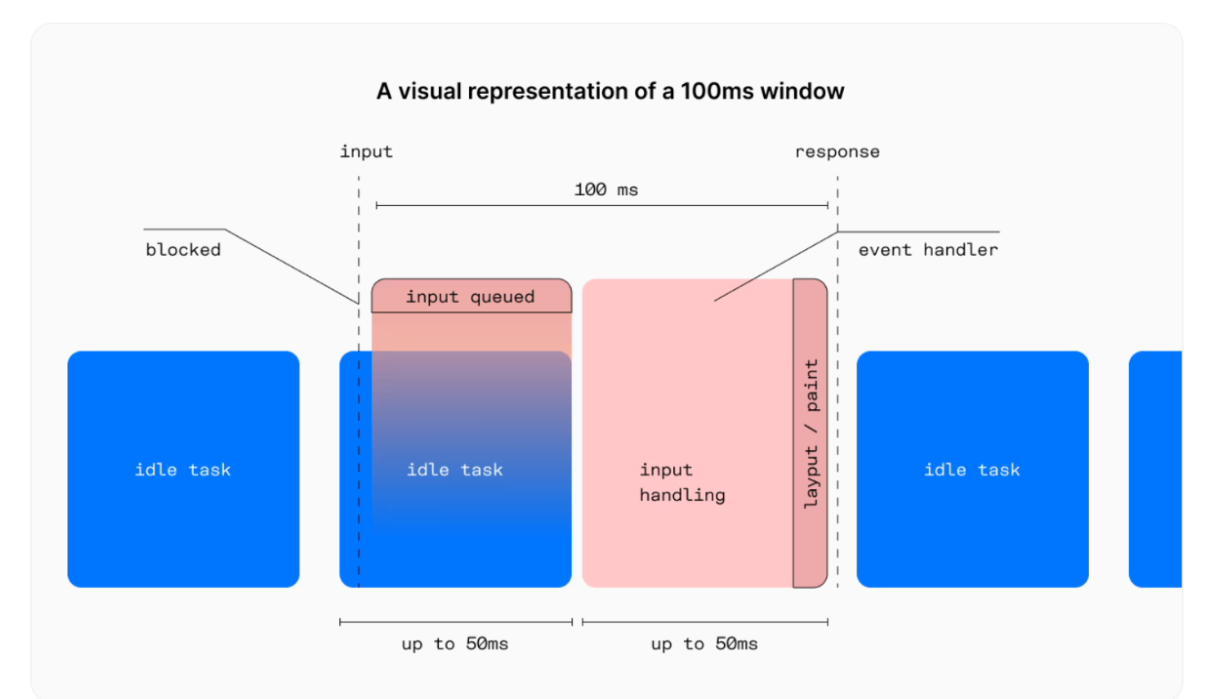
In the image above, we can see the following marked items:
Idle Task: Tasks that have not been processed and are idle.
Input Queued: When inputs are placed in a queue.
Input Handling: When inputs are being processed.
Layout/Paint: This is when the page is being designed and rebuilt.
These cycles make up the TBT time, so it's essential to minimize the duration of each section to enhance the user experience.
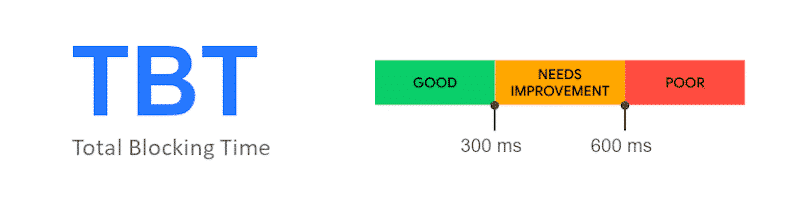
How to Optimize TBT?
Various methods can be employed to optimize Thread Blocking Time (TBT) and minimize negative impacts on page performance and user interactions.
The TBT metric is categorized into three ranges:
The green range (under 300 ms) is good, providing fast performance.
The yellow range (between 300 ms and 600 ms) requires improvement, indicating potential delays.
The red range (above 600 ms) is regarded as poor, which can significantly affect performance and user experience.
Several recommended methods and techniques include:
Reducing the impact of third-party scripts and plugins: To optimize TBT, you can decrease the load of additional and unnecessary scripts and plugins that significantly affect page loading. This can be done by removing or minimizing redundant scripts (such as unused CSS and JavaScript files) and limiting requests to external resources.
Minifying CSS and JavaScript: Using tools like Webpack and Babel, you can compress (minify) CSS and JavaScript files to achieve faster loading times. This process eliminates whitespace, comments, and other unnecessary elements.
Removing unused code: Tools like PurgeCSS can eliminate unnecessary CSS code from your project, thereby reducing the overall file size. This process also aids in assessing coverage through developer tools and pinpointing unused CSS.
Reducing JavaScript execution time: Optimizing JavaScript code and employing techniques like Lazy Loading can significantly decrease TBT by reducing script execution time.
Optimal use of server resources: To optimize resource loading, you can employ DNS Prefetching and Preloading for essential resources, such as CSS and JavaScript files. This approach also aids in prioritizing tasks for execution.
Optimizing TTFB: To enhance Time To First Byte, you can implement strategies like CDNs, database optimization, caching, and leveraging HTTP/2 or HTTP/3 protocols. These actions reduce server response time and speed up page loading.
Reducing blocking time in the main thread enhances the page loading and decreases the response time to user requests.
Identifying the cause of CPU activity: To mitigate the impacts of excessive CPU activity, it's essential to identify the primary sources of high CPU resource consumption. These issues may arise from heavy JavaScript code, inefficient parallel processing, or unnecessary server requests.
Reducing blocking time in the main thread enhances the page loading process and decreases the response time to user requests, ultimately improving the overall user experience.
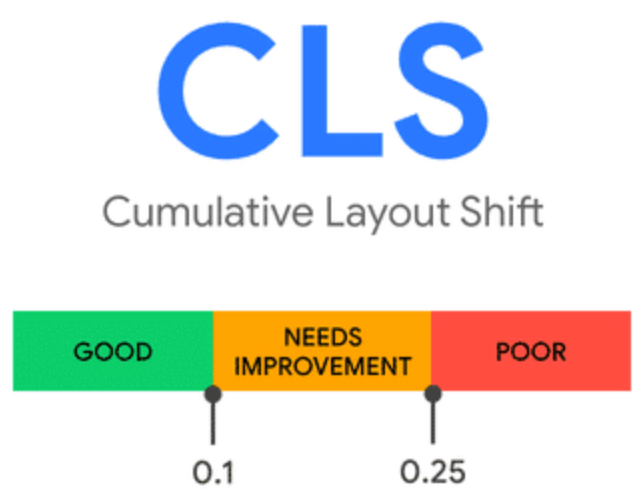
What is Cumulative Layout Shift (CLS)?
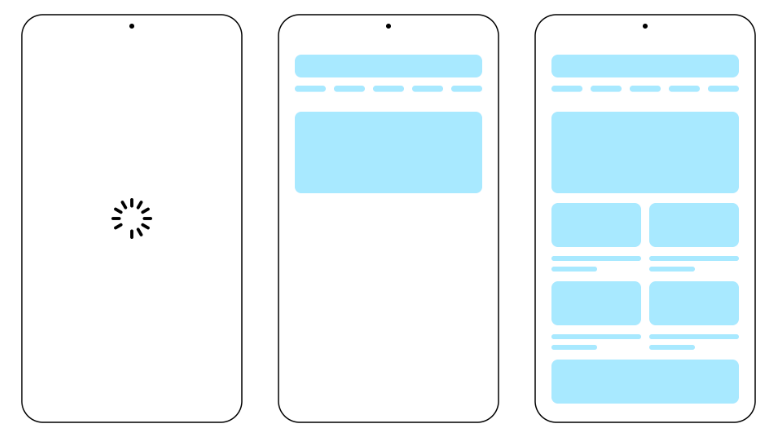
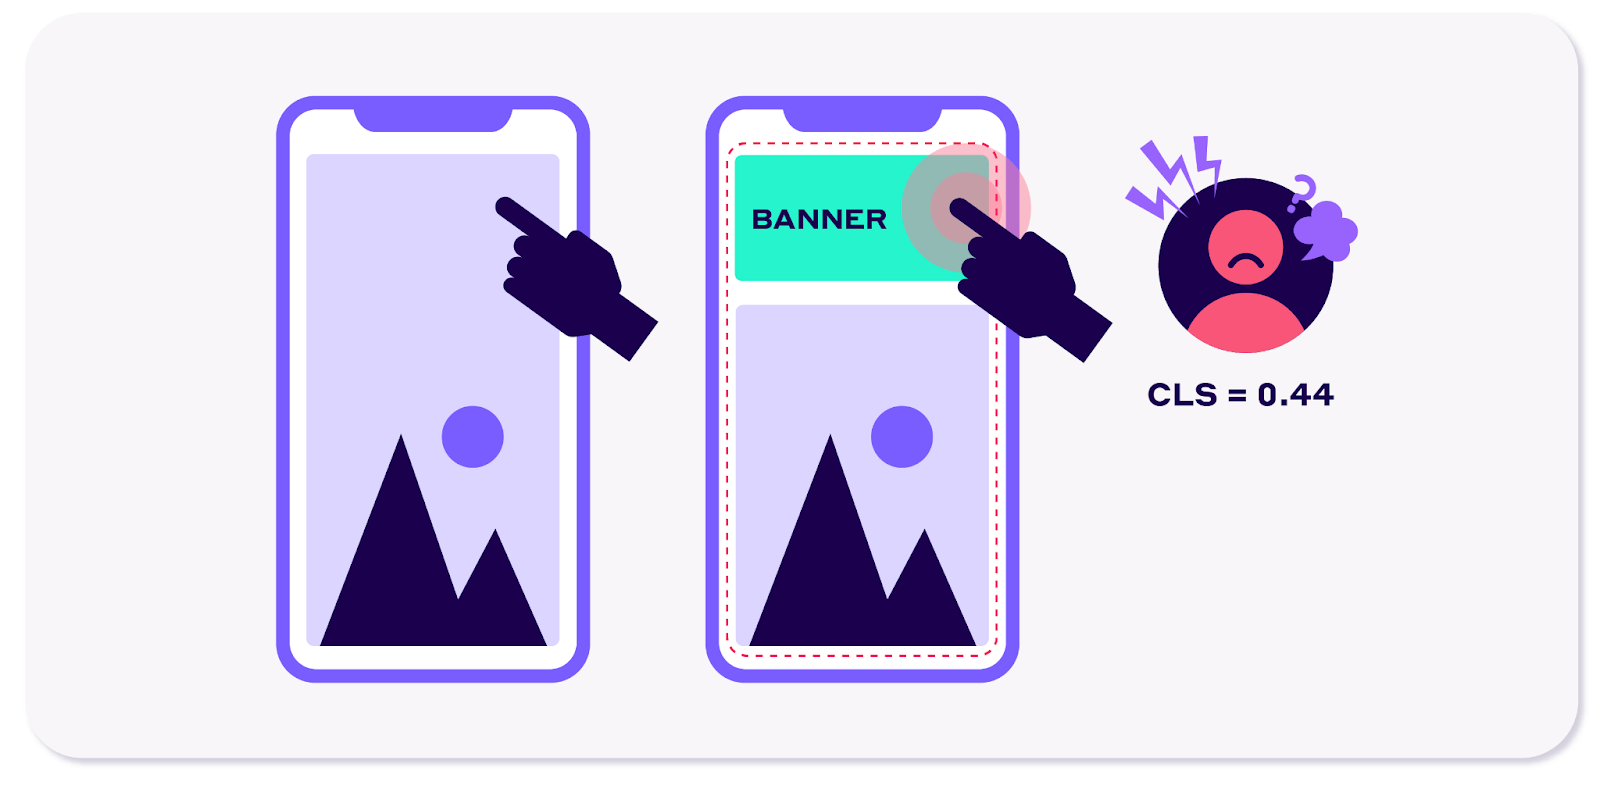
Cumulative Layout Shift measures how much the page “jumps around” while loading. Unexpected shifts are frustrating; for example, when you go to click a button but the page moves and you accidentally tap an ad.
Good: < 0.1
Needs improvement: 0.1–0.25
Poor: > 0.25
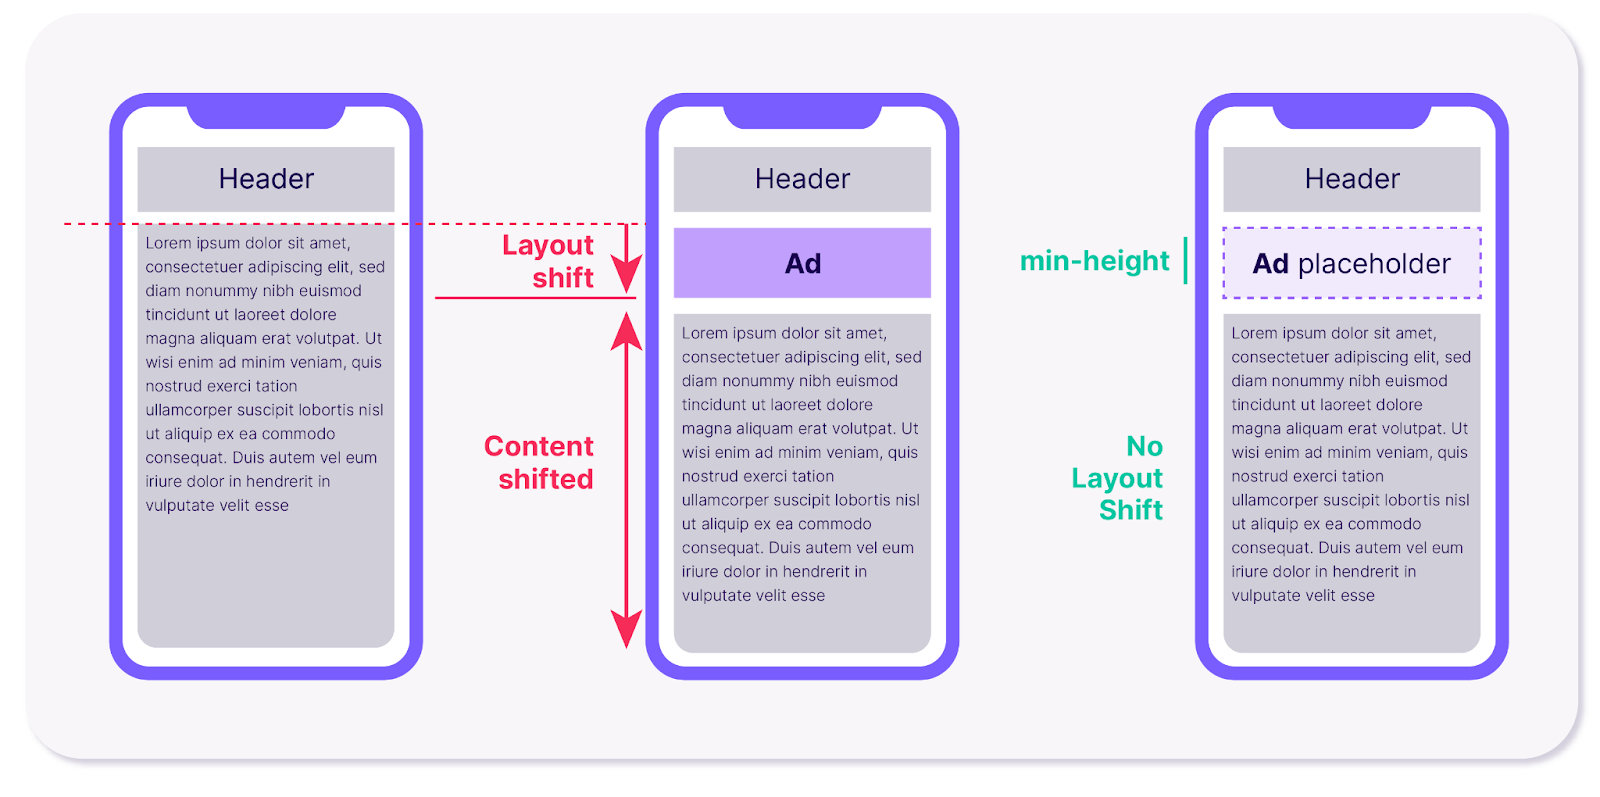
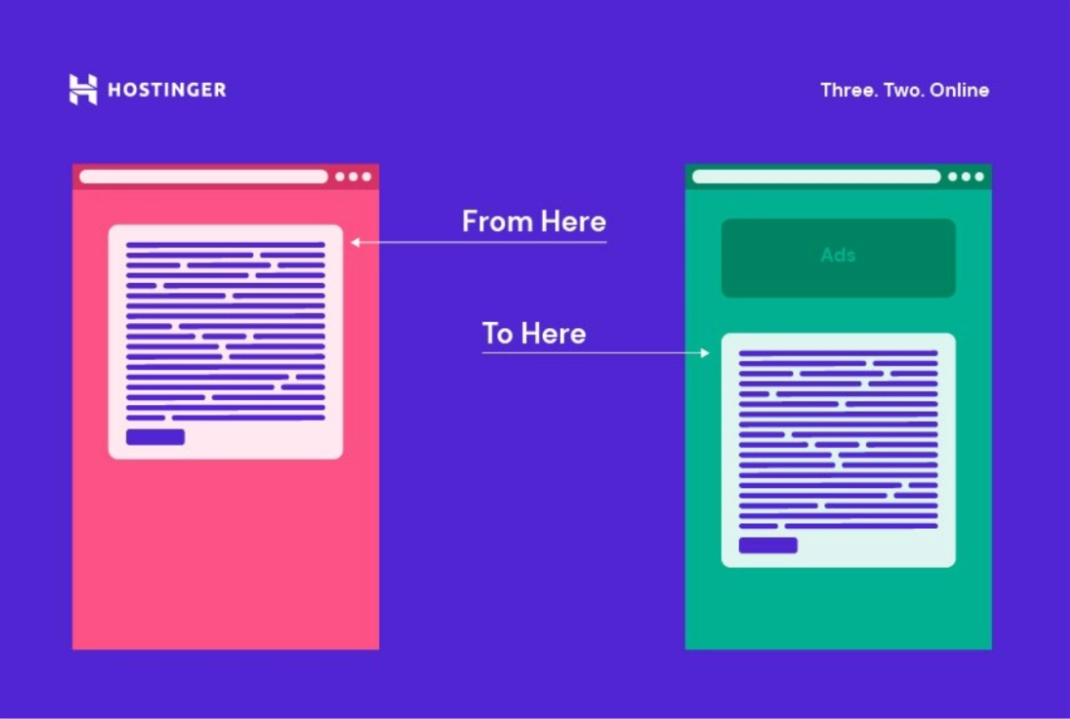
Common causes include missing image dimensions, late-loading ads or iframes, injected content, and web fonts that swap in after the page is displayed.
Formula simplified: CLS = impact fraction × distance fraction. In plain English, it measures how much of the screen shifted and how far it moved.
It is essential to understand that movements caused by animations and CSS changes are typically not accounted for as CLS. Therefore, if content changes dynamically, but no unexpected shift occurs in the page position, these changes do not adversely affect CLS. Additionally, clicking on buttons with animations or redirecting the user to another location does not result in layout changes. CLS is only calculated when page content unexpectedly shifts.
How do you calculate the CLS metric?
To measure Cumulative Layout Shift (CLS), two main components are used:
Impact Fraction: This metric assesses how element shifts affect the overall page. In other words, this section illustrates how much of the page is impacted by changes in element positions, expressed as a percentage of the total page that has shifted.
Distance Fraction: This metric measures how far an element has moved on the page. The displacement distance is calculated by dividing by the viewport height.
💡 The final formula for calculating the CLS Final CLS score = Impact fraction × Distance fraction

How can CLS improve user experience?
Here are the best methods for optimizing CLS and preventing unwanted changes in website page layout.
Speed and quality of video and image loading
If you use third-party media (such as YouTube videos or images) on the page, use CSS to set their fixed dimensions to prevent unwanted resizing of pictures and videos.
Limit the parent DIV to a specific height and width
Dynamic content that loads late should be considered in the lower part of the page to prevent element shifting.
Fonts
Using the Font Loading API and rel=preload can help reduce font loading time.
Set fonts that have a similar style to your system's default fonts. Using the Font Loading API enables this and causes fonts to load faster.
Setting width and height properties on img tags and using CSS to resize images: To avoid unwanted content shifting on the page, you should specify the exact width and height for img tags. This ensures that images reserve their appropriate space in advance and do not resize suddenly during loading.
Using CSS transitions for animations (which don't change page layout): When implementing animations for changes in page elements, CSS transitions ensure that modifications occur smoothly without causing abrupt shifts in the layout. This helps prevent unwanted content movement. Additionally, utilizing properties like transform can change positions or sizes without impacting the page layout. This allows for smooth transitions in colors, sizes, and positions, preventing sudden shifts and disruptions in the layout, which ultimately helps reduce CLS.
Using the back-forward cache (BFCache): After loading, web pages are stored in the browser's cache and can be quickly retrieved when needed. This allows pages to load rapidly and minimizes cumulative layout shift (CLS).
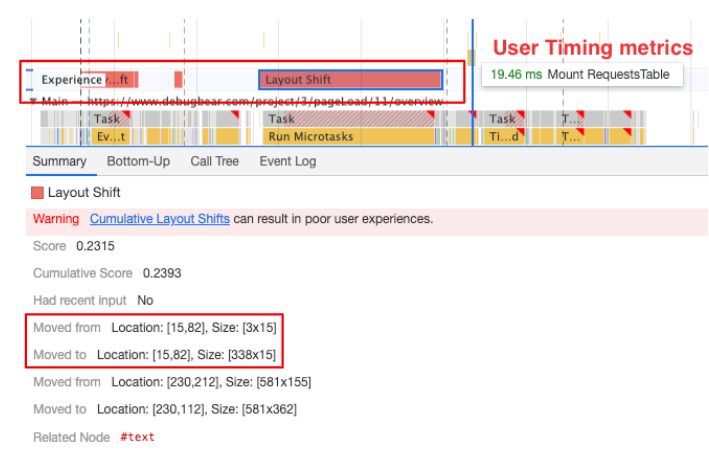
Debugging Cumulative Layout Shift (CLS) in the Performance Devtools tool
In the example below, we can see a layout shift on the page in the Experience line, which leads to a negative user experience. By clicking on it, you can view the detailed information in the Summary section at the bottom of the page:
Moved from: The initial position and size of the elements.
Moved to: The new position and size of the elements after the shift.
So here we have a practical example from personal experience in optimizing a video streaming page.
Experimental example: Optimizing CLS on a Video Streaming Page
Our team was working on a video streaming website that offers high-quality video content, user profiles, and image galleries. We wanted to improve the UX and prevent CLS. Here is how to implement best practices to optimize CLS:
Speed and Quality of Video and Image Loading
One of the main issues in video streaming pages is that videos and images often load late or take a while to load, causing layout shifts. A YouTube video embed might resize or shift the layout if it's not given a predefined space to occupy.
Solution: We used CSS to specify fixed dimensions for all third-party media (such as YouTube videos). This prevents the content from resizing during loading.
/* Example: Setting fixed dimensions for embedded YouTube videos */
iframe {
   width: 100%;
   height: 315px; /* Fixed height */
   max-width: 560px;
}
Additionally, we made sure that images were not dynamically loaded without the proper size. By specifying the width and height attributes on the img tag, we were able to reserve space for the images before they finished loading, preventing sudden changes in the layout.
<img src="image.jpg" width="600" height="400" alt="Video Thumbnail">Limit the Parent DIV to a Specific Height and Width
Sometimes, Page content, such as dynamic elements or ads, can load late and cause layout shifts as they appear unexpectedly in the layout.
Solution: We constrained the parent DIV to a specific height and width. This is especially useful for dynamic content that may load slowly or after the page has been rendered.
/* Limit parent div dimensions */
.div-container {
  width: 100%;
  max-width: 800px;
  height: 500px; /* Predefined height to avoid shifting */
  overflow: hidden; /* Prevent unexpected content overflow */
}
By doing this, we prevented sudden changes in the layout, even when the dynamic content loads.
Font Optimization
Fonts can cause layout shifts if they load late or if the font style is different from the system's default.
Solution: By using the Font Loading API and rel="preload", we were able to preload important fonts to ensure they load as quickly as possible. Furthermore, using fallback fonts that are similar to the default system font style will help maintain the layout stability while the actual font loads.
<!-- Preload the font to speed up loading -->
<link rel="preload" href="font.woff2" as="font" type="font/woff2" crossorigin="anonymous">
<!-- Use a similar system font as fallback -->
<style>
body {
  font-family: 'Roboto', sans-serif;
  font-display: swap; /* Fallback to system font during loading */
}
</style>
This helps in reducing the impact of font changes on the layout and minimizes the CLS.
CSS Transitions for Smooth Animations
Animations or dynamic changes in page elements (like opening a dropdown or expanding a sidebar) can cause layout shifts if not handled correctly.
Solution: We use CSS transitions for animations, which help make changes smoothly without affecting the page layout. The use of transform and opacity ensures that the element can change without causing layout shifts.
/* Smooth animation for dropdown */
.dropdown {
  transition: transform 0.3s ease, opacity 0.3s ease;
}
.dropdown.open {
transform: translateY(0);
opacity: 1;
}By applying these CSS transitions, the changes happen gradually, without causing any abrupt shifts in the page layout, thus reducing the overall CLS.
Using Back-Forward Cache (BFCache)
For users navigating through your website (e.g., moving back and forth between pages), the back-forward cache (BFCache) can be an important tool in reducing CLS.
Solution: The BFCache enables faster page loading when users go back to a previously visited page, as the browser stores the page in memory. This prevents reloading the page entirely, allowing the layout to stay stable and reducing CLS.
<meta http-equiv="Cache-Control" content="max-age=3600">By leveraging the BFCache, pages can load almost instantly when navigating back, preventing unexpected layout shifts and enhancing the overall user experience.
By implementing these strategies on our page, we effectively reduce CLS. This not only improves UX but can also help rank better in search engines, as Google prefers pages with low CLS and faster loading times.
Conclusion
Improving your website’s user experience isn't just about ticking SEO boxes—it's about genuinely meeting your users' needs. Paying attention to Core Web Vitals like LCP, INP, and CLS, along with key factors like mobile responsiveness, accessibility, and intuitive site structure, can dramatically enhance how people engage with your site and how Google perceives its value. But keep in mind that optimizing UX is an ongoing journey. Google’s algorithms continually evolve, but their goal stays consistent: rewarding websites that put users first.

Nazanin Teymouri is an SEO Manager with over 7 years of specialized experience in developing SEO strategies, technical SEO, and data analysis in competitive markets and e-commerce. Blend technical knowledge with the strategic vision to implement tailored SEO solutions that consistently enhance search rankings and increase organic traffic for my client's digital properties.
Related Articles
 Rescuing a Migration: A Guide for SEOs Brought in Too Late


 Agency Technical SEO in 2026: AMA with Tory Gray & Patrick Hathaway

 JavaScript SEO AMA with Sam Torres: 13 Questions & Answers

 Sitebulb Desktop
Find, fix and communicate technical issues with easy visuals, in-depth insights, & prioritized recommendations across 300+ SEO issues.
- Ideal for SEO professionals, consultants & marketing agencies.
 Sitebulb Cloud
Get all the capability of Sitebulb Desktop, accessible via your web browser. Crawl at scale without project, crawl credit, or machine limits.
- Perfect for collaboration, remote teams & extreme scale.