
 Sam Torres
Huge thanks to Sam Torres, CDO at Graydot Co, for producing this guide to doing a JavaScript audit for SEO.
I know you're here to see how to run a JavaScript audit. But before we get into any of that, can we take a moment for a little tech SEO mantra?
JavaScript isn't inherently bad for SEO…
Now hold onto that. Because at one point in the short-lived lore of our discipline, it was generally accepted that any content contained in JavaScript couldn't be understood by crawlers. Though today, the idea that JavaScript (JS) can't play nice with search engines is a carryover from the pre-times.
JS creates powerful experiences, and those experiences inspire users to engage with content and products. That's not just important for SEO, it's the crux of running a successful business. Plus, there are plenty of dynamic, JavaScript-powered sites that allow search engine crawlers to efficiently discover, crawl, and index content.
The key to reaching that goal and maintaining it is the ability to find and diagnose JavaScript issues. That starts with a JavaScript SEO audit.
Below, I'll break down each step of the audit process and show you how Sitebulb can make things a lot easier. (Don't worry, if you're not using Sitebulb, we'll cover those bases too.)
Interested in learning about JavaScript SEO? Register for our free on-demand training sessions. Sign up now
Contents:
Step 1: Make sure it's a JavaScript site
Developers use JavaScript frameworks and libraries - essentially collections of pre-written code - to create more sophisticated sites in less time.
Frameworks in particular are a pretty big deal in the dev world because they include many of the building blocks for building an application already. There are hundreds out there, though the ones you'll run into most often are React, Angular, and Vue.
No matter which one your site is built on, it takes unique finetuning to optimize for search engine crawlers (while still providing an awesome experience for users, of course).
It's not your job as an SEO to know the ins and outs of different frameworks, but if you know how to identify them, it can help narrow the search for common issues. Plus, the dev team is going to be low-key impressed when they see it in your issue documentation!
Use Wappalyzer for a snapshot
Enter: Wappalyzer. This handy Google Chrome extension serves up a site's building blocks in a single, at-a-glance snapshot, including JavaScript frameworks, libraries, and any related tools or plugins.
While there are other methods of detecting a JavaScript website, this is one of the easiest and doesn't require a crawl.
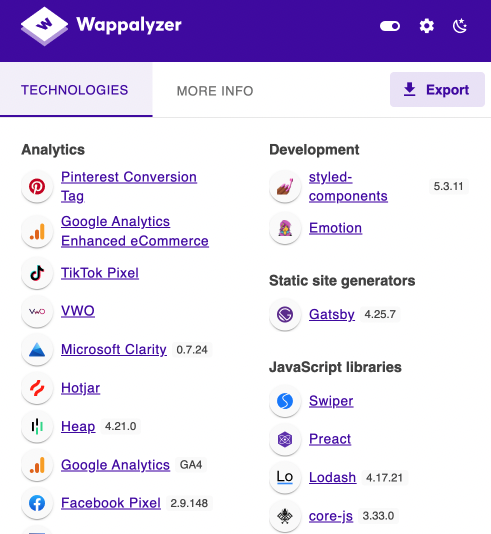
For JavaScript-enabled sites, Wappalyzer will show line items in the “JavaScript Library” and/or “JavaScript Frameworks” categories. If that's what you see, then your site uses JavaScript to serve content in some way, shape, or form. Keep reading!
If you don't see results for either category, then your site's content is likely not served through JavaScript.
There is, however, a small chance your site has JavaScript-related content and Wappalyzer can't recognize it. So if you fall into this category, I recommend using this bookmarklet or the View Rendered Source Chrome Extension to confirm visually. (I'll bring this extension back up a little later.)
Once added to your bookmarks bar, it'll show you a side-by-side comparison for any URL - with and without JavaScript. If you're not seeing any differences, such as missing content or functionality, then sadly, this article won't be helpful for you beyond this point.
Step 2: Look at the big picture
Most JavaScript SEO issues are going to trigger errors on multiple pages because they apply universally or occur within widely used page templates.
While that's not good news in terms of the scale of potential negative impact, it's good news for a solution because these types of issues can be fixed globally. (Small fixes with big impact are more likely to receive engineering attention!)
The easiest way to find issues and assess their true scale is to run a crawl using a third-party tool like Sitebulb.
Crawl your site
Since Patrick already put together a robust Sitebulb guide on how to crawl a JavaScript website, I'll stick to the basics here.
Create a new project and select Chrome Crawler to enable JavaScript rendering (or the equivalent if you're using another tool).
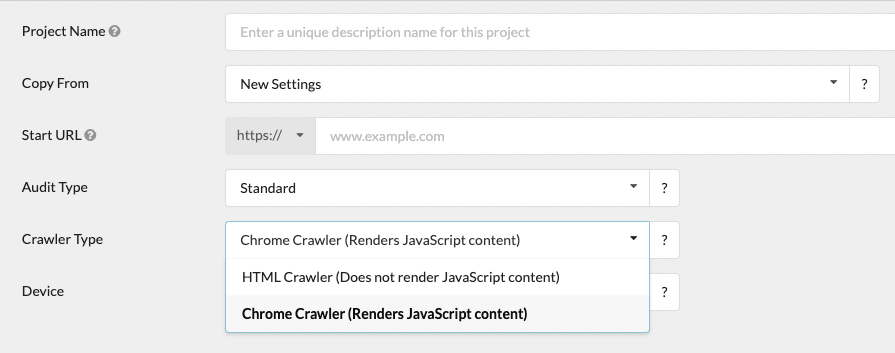
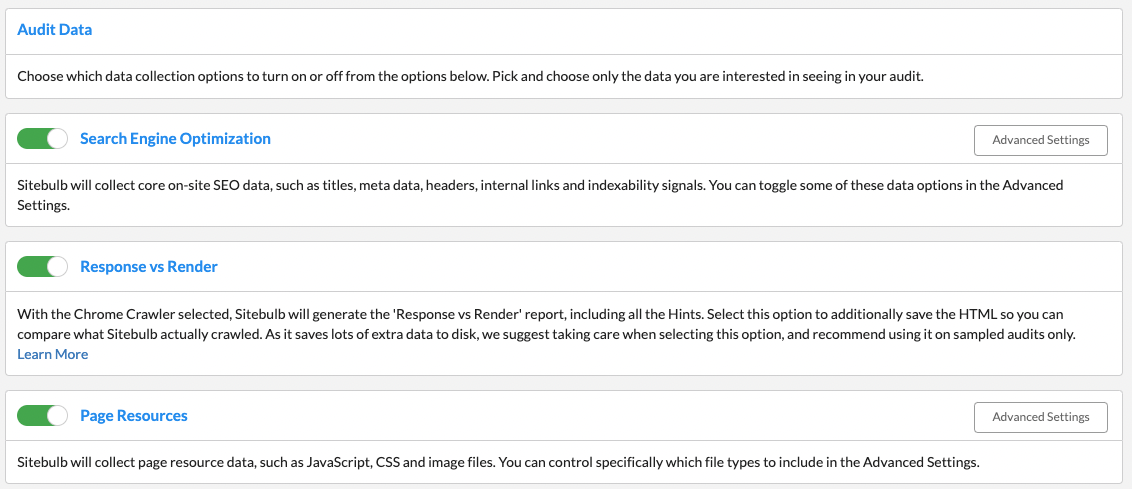
On the next page, make sure to turn on the “Response vs Render” report, which will come in handy when we start to validate issues at the page level.
Note: Sitebulb does an awesome job identifying and grouping issues in its crawl report. Check out the “Hints” tab, which also appears in each issue category.
Pinpoint the patterns
At this stage, we're looking for universal issues or problematic micro-patterns that are going to cause SEO detriment whether or not Google chooses to render page content.
Some of the main issue buckets to keep an eye out for include:
Indexability is wrong - likely because crucial
elements such as canonical URLs and meta robots directives are being served via JavaScriptOrphan pages or low internal links - could be improperly coded hyperlinks or links hidden in content that only appears after a user interaction (like an accordion drop-down or lazy-loading setup)
Lots of 404 status codes - by not serving a 404 status code from your SPA, which means Google just sees a lot of thin, unoriginal content
Redirects aren't registering as 3{xx} status - possibly because redirects are served client-side instead of at the server request (which also means they're not passing link equity, yikes!)
Resources aren't available - when the robots.txt is blocking JS, image, or CSS files
Step 3: Zoom in on rendering
There are JavaScript SEO issues you can't see without visually analyzing the rendered page and HTML. More specifically, you have to see it through a search engine crawler's eyes.
That doesn't mean manually checking every page (pause for a collective sigh of relief) — just checking any templates used for indexable pages. You'll probably come out with a list of three to eight depending on how big the site is.
For example, an eCommerce site might have templates for product detail pages (PDPs), product listing pages (PLPs), and blog articles. They would want to analyze the most business-critical URL from each of these categories, along with the homepage and any other crucial templates or pages.
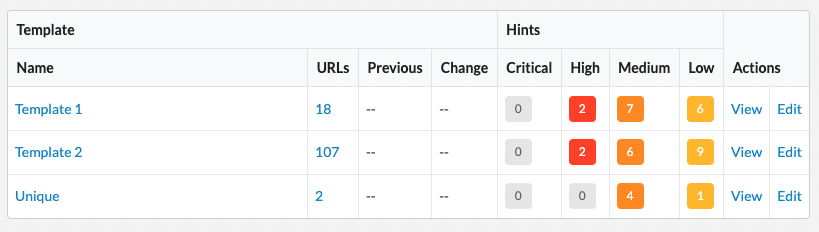
Pro tip: One feature of Sitebulb that can be really useful in narrowing down where to look for and validate issues is the “Response vs Render” report, which groups pages based on their template.
Check the rendered HTML for key SEO elements
All of the SEO elements should be available to crawl in the rendered HTML — including head elements, copy, links, images, and markup.
Missing elements could be an issue if:
They're not served in the pre-rendered HTML either, so search engines have no way of crawling them.
Your site uses client-side rendering and the on-page elements require clicking or scrolling to load.
JavaScript is removing elements on the page that are served in the pre-rendered HTML (which Google might see as suspect).
JavaScript resources are unavailable, possibly because they're blocked from crawling by the robots.txt.
Things you might not see (which is okay!)
Structured data implemented using JavaScript Object Notation (JSON), since it won't surface in a non-JS view (JSON is the preferred method for Google as of March 2024, so this is A-OK!)
Content animation, as long as you can still see the content itself
Background images
Common issues you might find
Missing closing tags (in HTML or JavaScript code) that can disrupt crawling
Syntax errors like simple misspellings or missing quotation marks in the code
Links that users see on the page but are missing from the rendered HTML
Content in click-to-view elements, like drop-down menus, tabs, and accordions, isn't rendered
Lazy-loading elements, such as core page copy or links aren't rendered
Animations using JavaScript, which are expensive on performance compared to CSS Animations
Unused APIs, which can be very costly in processing power
Canonical tags and/or meta tags that don't match your expected responses
How to view rendered HTML
Sitebulb Response vs Render Report
Since you turned on the Response vs Render report when you ran your crawl back in step two, you have the rendered Document Object Model (DOM) and HTML already. Navigate to them by clicking on the URLs tab.
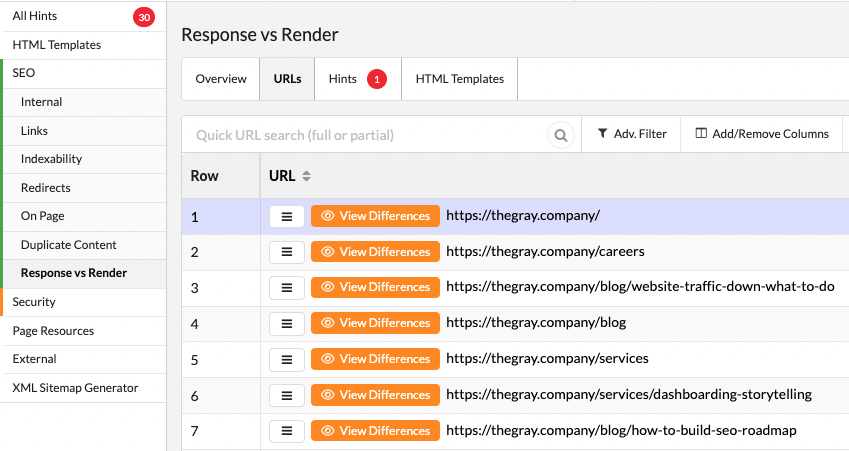
For any URLs that you selected to review, click “View Differences” to see the rendered DOM and any HTML from the initial server response.
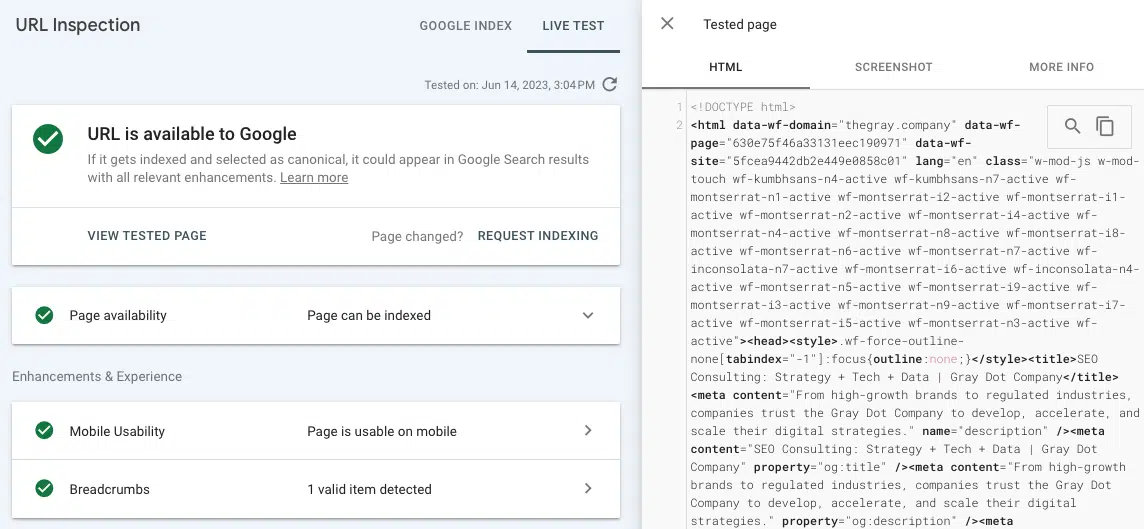
Google Search Console Test Live URL
This tool in GSC will crawl and render a page, surfacing the rendered HTML in about a minute. You can find it by going to URL inspection, pulling up the URL you're analyzing, and clicking Test Live URL in the top right.
Once it runs the test, the “View Tested Page” option will pull up the rendered HTML and more. The downside is that you'll have to find SEO elements manually, using the search function to locate them in the code.
Step 4: Gauge dependence on JavaScript (and whether it opens you up to issues)
This is where JavaScript SEO can get a little heady. Even if your site is serving all of the right pieces in the rendered HTML, it's not inherently optimized for SEO.
Why? Because Google. Well specifically, because of the way Google renders and crawls pages (if it even chooses to do so).
Key JavaScript rendering considerations
Patrick has, yet again, compiled a pretty awesome article all about how Google crawls, renders, and indexes JavaScript. It's an absolute must-read, but the key takeaway I want to extract and drive home is…
JavaScript can change key elements on a page after rendering, and that could be a problem.
There are a couple of points we need to add to this.
It's not a given that Google will render your content
Rendering takes resources, and resources cost money. Key signals like internal links from authoritative pages, backlinks from external websites, and a pre-rendered canonical URL help Google gauge whether URLs are valuable, and in turn, worth rendering.
A good place to check whether Google is rendering your pages is the “Crawled – currently not indexed” report in GSC (Pages > Page indexing). If pages that should be indexed are on this list - especially priority pages - it's a sign that they're waiting in the rendering queue.
Note: If you're not sure what I mean by rendering queue, then definitely go back and give Patrick's piece a read!
Search engine crawlers can't perform user interactions
An easier way to think about it is that crawlers can't scroll or click, which is especially important if you work on a site that serves most of its HTML client side.
This comes into play with things like:
accordions that hide content until you click the dropdown.
lazy-loading that requires scrolling to render links below the fold.
If it's not in the server-response HTML, Google can't crawl it at all, because it won't render without a user interaction.
What the server response & rendered DOM can tell you about your site
JavaScript sites generally fall into one of three categories: server side, client side, or a hybrid. The Sitebulb Response vs Render report overview makes it pretty easy to determine which applies to your site.
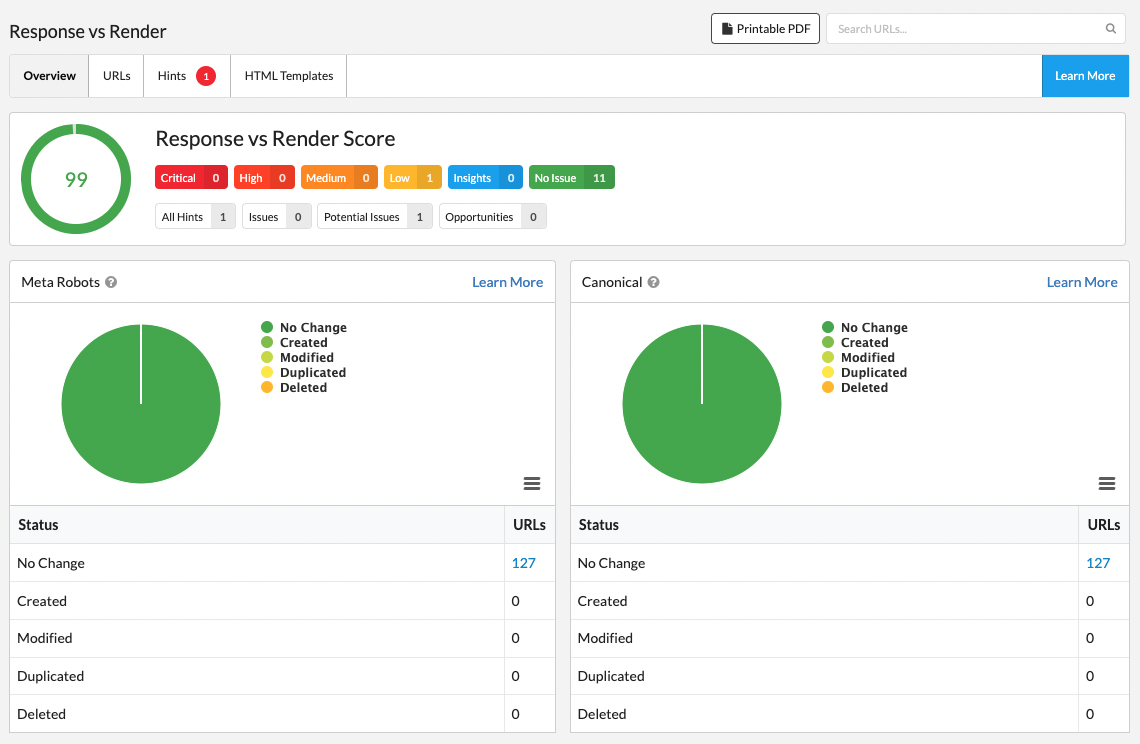
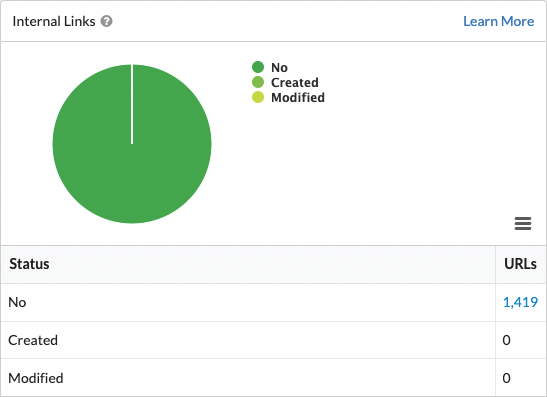
Server-Side: Pre-rendered HTML is effectively the same as the response HTML
The site is not dependent on the browser doing the rendering, because all of the key elements are in the pre-rendered HTML coming from the server response, and that makes Google's job easier (Google likey!).
In short, all of the work of executing the JavaScript is happening on the server where the website is, instead of requiring the user's browser to execute and interpret it. Because the execution is done before it hits the user's screen, this type of site is generally safeguarded from changes made by JavaScript. Additionally, it doesn't depend on Google moving URLs through the rendering queue to get them indexed.
The Response vs Render report will have a high score and minimal reports of elements that are created or removed, like the site in the image above. It is, however, one of the more costly methods when it comes to website architecture and maintenance.
Client-Side: Pre-rendered HTML is significantly different from response HTML
This type of site depends on the user's browser to serve a majority of key elements, because the HTML isn't in the server response. Client-side rendering is the out-of-the-box setting for a lot of JavaScript frameworks.
Sites in this bucket will show a high number of “created” elements in the Response vs Render report. And if you look at “View Differences” for a given URL, you'll see a fairly sparse response DOM.
A site using client-side rendering for its JavaScript can be perfectly fine as long as it's serving all the elements in the rendered HTML, ensuring URLs are discoverable, and making them available to crawl. But it does make Google work harder to understand site content.
Hybrid: Pre-rendered HTML is somewhat different from response HTML
Here, the server-response HTML loads most of the data, but JavaScript comes in and makes some changes afterward. The degree of change can vary, but since there's still content that needs to be rendered, URLs may still be at the whim of the rendering queue.
A good indication of this type of site is usually a score somewhere in the middle on the Response vs Render report.
The key difference to note is that plenty of information can surface in an HTML crawl, which makes it easier for discrepancies to sneak under the radar without a JavaScript audit. So for hybrid sites, comparing HTML from the server response to the rendered HTML is a must.
Step 5: Find potentially harmful discrepancies
If your site is serving SEO-vital page content in the pre-rendered HTML, the biggest thing is making sure that the rendered HTML isn't contradicting, overriding, or duplicating those elements.
That's because even a seemingly unrelated development change can have unseen implications on elements like:
Meta robots
Canonicals
Titles
Meta Descriptions
Internal Links
External Links
Finding any changes is a matter of comparing the server response to the rendered DOM. If you're using Sitebulb Response vs Render, you already have individual reports for each of these elements, as well as which URLs show discrepancies.
Note: Regardless of which of the three rendering buckets your site falls into, you also want to ensure that crucial head elements - SEO title, meta description, canonical URL, and meta robots - are part of the server response HTML.
How to Compare With Sitebulb
Even with the Response vs Render report, you'll still need to look deeper than the “Overview” tab to find and validate what's getting changed, added, or removed by JavaScript.
The nice thing is that Sitebulb calls out any discrepancies between the two sets of HTML in the “View Differences” report, so you don't need to search through any source code manually.
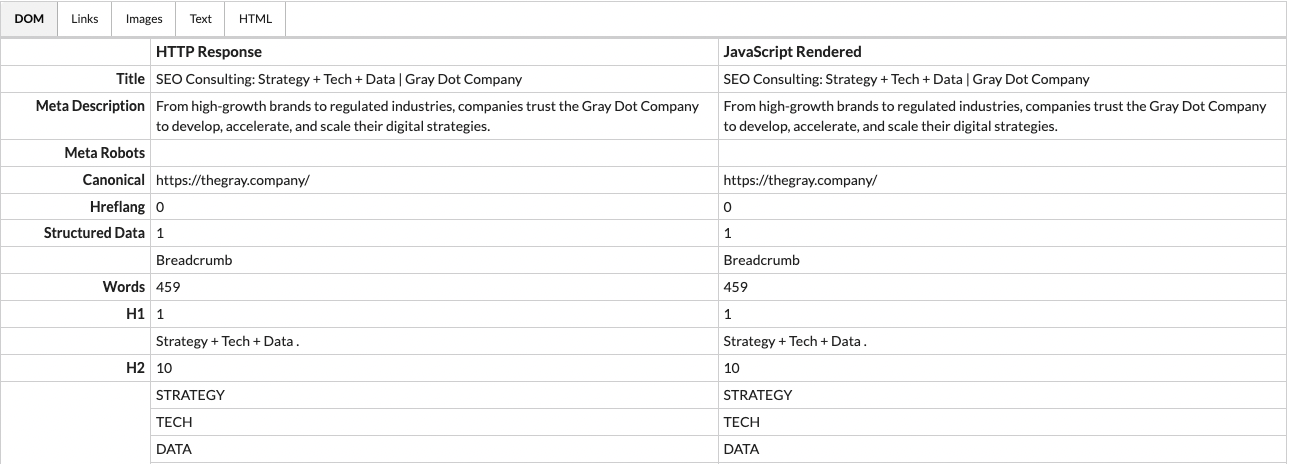
For example, in the “DOM” tab, you can see the discrepancy between rendered and pre-rendered images for this site:

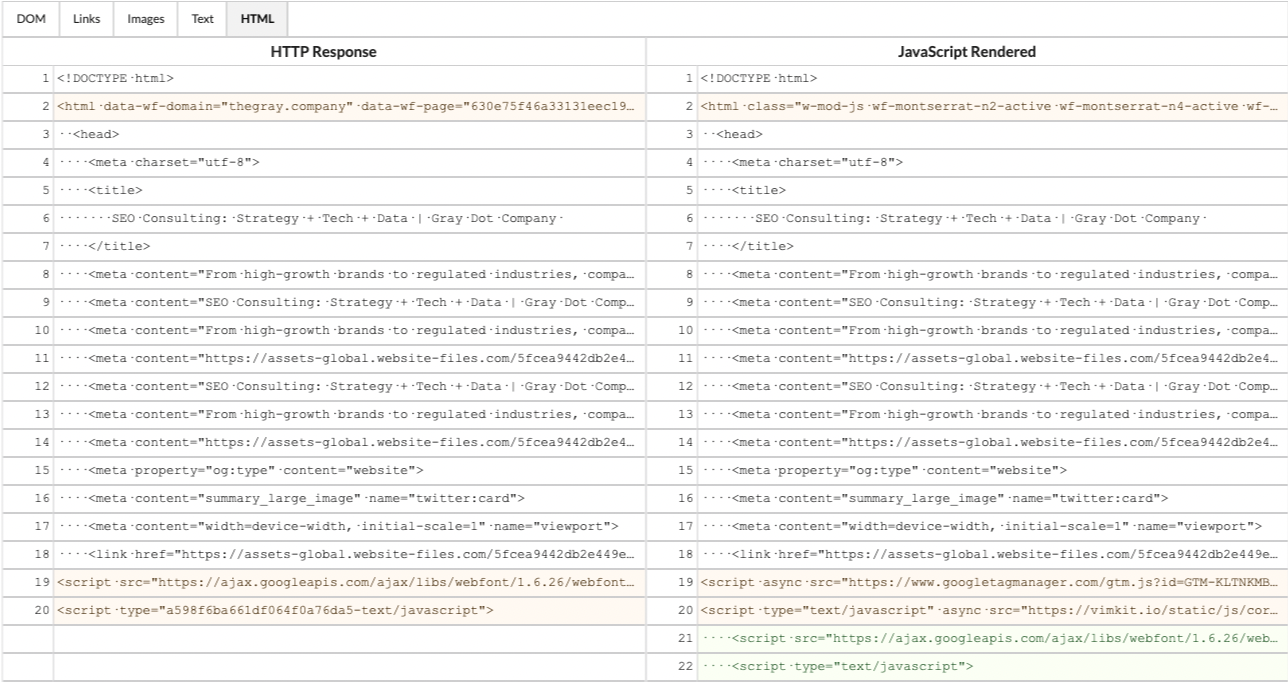
The “HTML” tab shows any changes, color-coded by whether they were added (green), removed (red), or changed (orange) by JavaScript . This is helpful because if you were to see a word-count discrepancy between the two versions of HTML in the DOM, you could dig in to find exactly which language was altered.
How to Compare Without Sitebulb
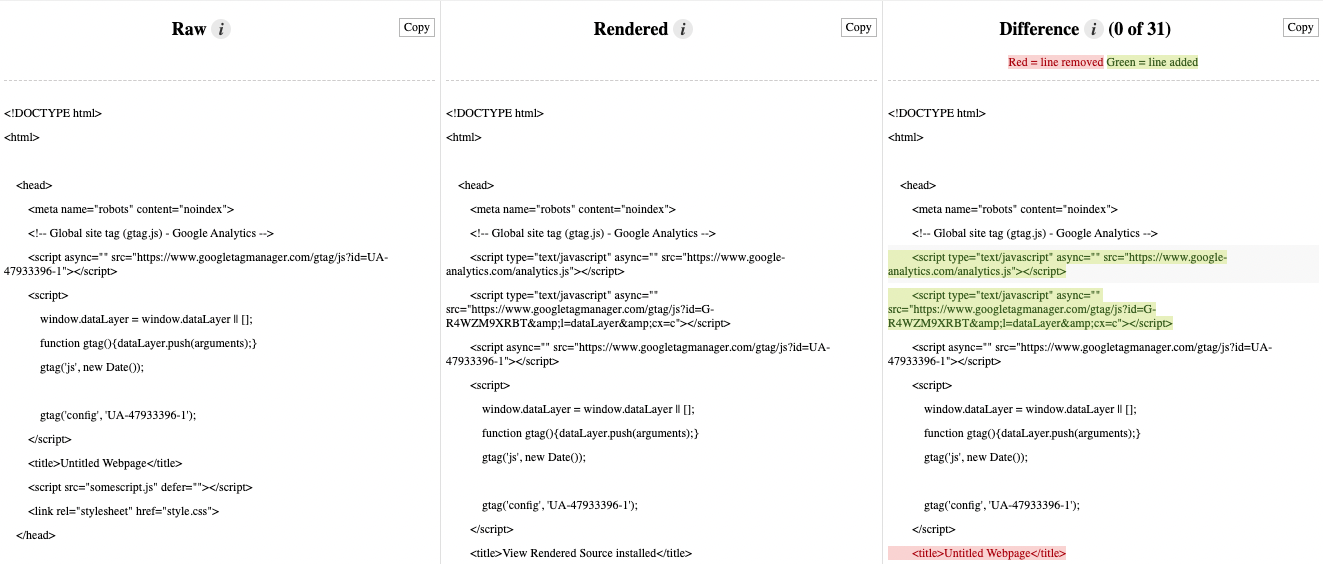
View Rendered Source is a useful Chrome extension that can show you a side-by-side comparison of server-response HTML versus rendered HTML. It will also highlight HTML that's added or removed by JavaScript in the rendering process.
Unlike with Sitebulb, you'll have to look for any SEO elements in the code manually to determine which are present or missing. Plus, you don't get the benefits of scoring and crawling at scale, which are both pretty valuable in a JavaScript SEO audit.
Now show the team why it matters
You know your tech stack, you've found the issues, and you hunted down any discrepancies. Since you're monitoring things like rankings, traffic, and indexation regularly, you also probably have a good sense of how it's all impacting performance. (Or more likely, the numbers are what kicked off your JavaScript SEO audit in the first place.)
The thing is, implementing the fix(es) is development work. And any development work needs to win a spot on the Product & Engineering roadmap. That means you have to take all of the dots connected in your audit and draw those lines for the team, so they see it's worth the resources of investigating and implementing a fix.
To do that in a way that makes sense for all stakeholders, build an SEO business case for the JavaScript issues you've identified. That's your next step from here!
You might also like:
Can Google Crawl JavaScript Links? Guide to SEO, Links and JavaScript
Real-World JavaScript SEO Problems [Webinar Recording]

Sitebulb is a proud partner of Women in Tech SEO! This author is part of the WTS community. Discover all our Women in Tech SEO articles.

Formerly of Gray Dot Co, now as the Tech SEO Senior Manager at Pipedrive, Sam Torres uses her multidisciplinary background as a developer and data architect to solve complex problems at the intersection of marketing and technology. She is known for blurring the lines between disciplines to deliver creative, high-impact technical strategies with a transparent and honest approach.
Related Articles
 SEO & UX: Organic Growth via “The Retention Ladder”

 AI Search, RAG, Agents and Crawl Bots: A Plain-English Guide to What They Mean

 What AI Agents See: The Accessibility Tree Is an SEO Surface
 Sitebulb Desktop
Find, fix and communicate technical issues with easy visuals, in-depth insights, & prioritized recommendations across 300+ SEO issues.
- Ideal for SEO professionals, consultants & marketing agencies.
 Sitebulb Cloud
Get all the capability of Sitebulb Desktop, accessible via your web browser. Crawl at scale without project, crawl credit, or machine limits.
- Perfect for collaboration, remote teams & extreme scale.