The Sitebulb Code Coverage analysis is designed to help technical SEOs identify potentially wasted code. Particularly, instances where CSS and JavaScript code files are loaded but not used for rendering, whether totally or partially.
Because CSS and JS are render-blocking resources, delivering this code efficiently can have noticeable impacts on your page load speeds and mobile data usage.
To enable the Code Coverage report, set up your audit with the Chrome Crawler, which executes JavaScript, and enable the Performance & Mobile Friendly report.
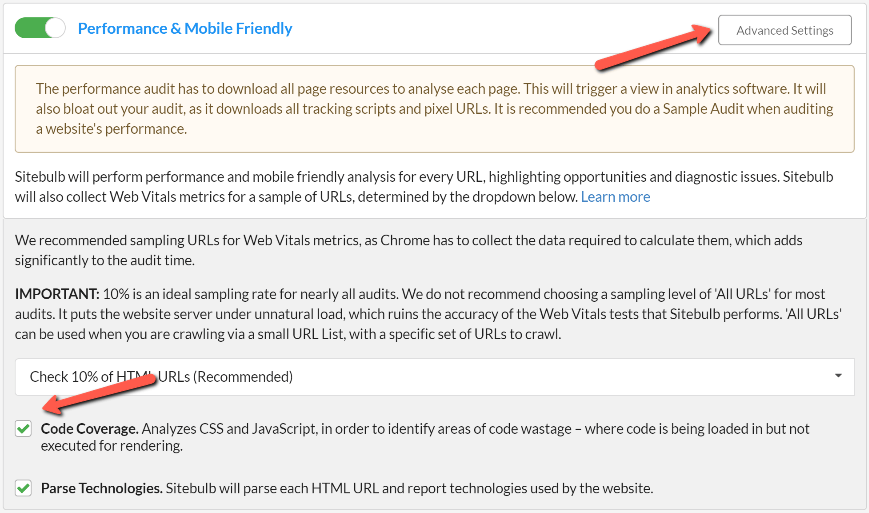
Code Coverage is selected by default when you enable the Performance & Mobile Friendly report, you will find it under Advanced Settings.
* Note: The Code Coverage audit is not sampled in the same way Web Vitals Metrics are. With this setting enabled, Sitebulb will check the code coverage for every page and each file found during the crawl.
Once you have run your audit, you will find the Code Coverage report in the left-hand side menu.
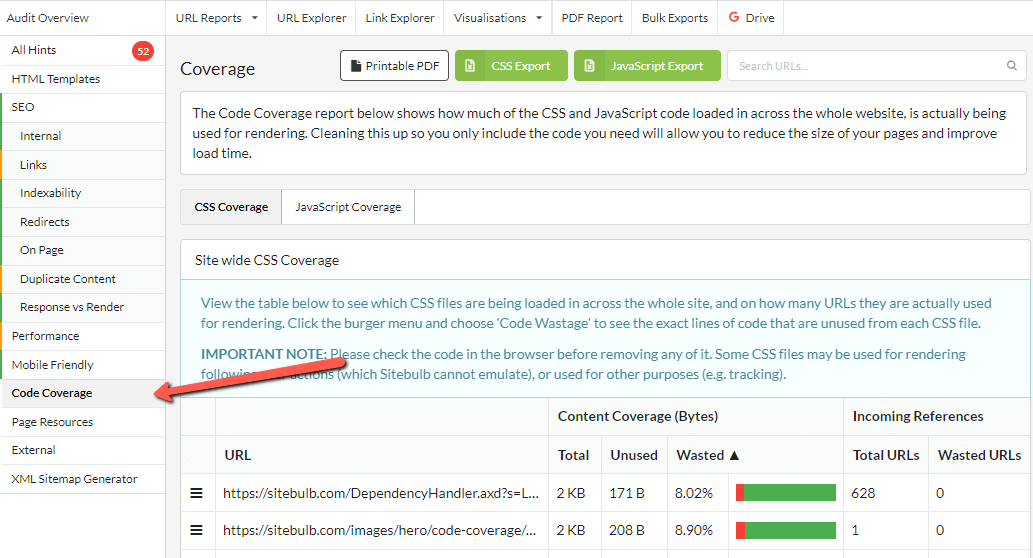
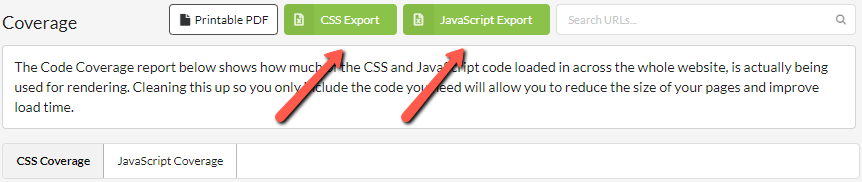
You’ll see two tabs at the top of the report, and you can toggle between them to view site-wide CSS and JS coverage data.
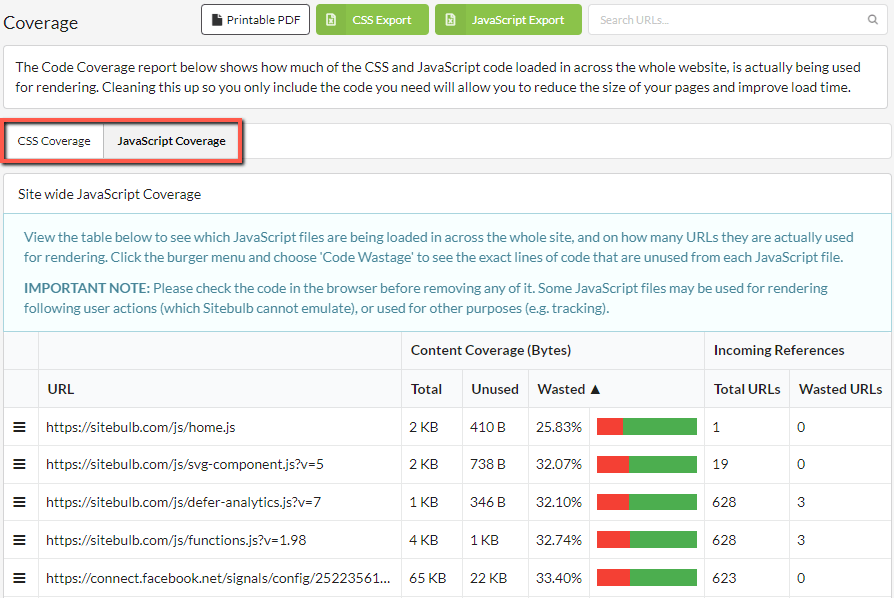
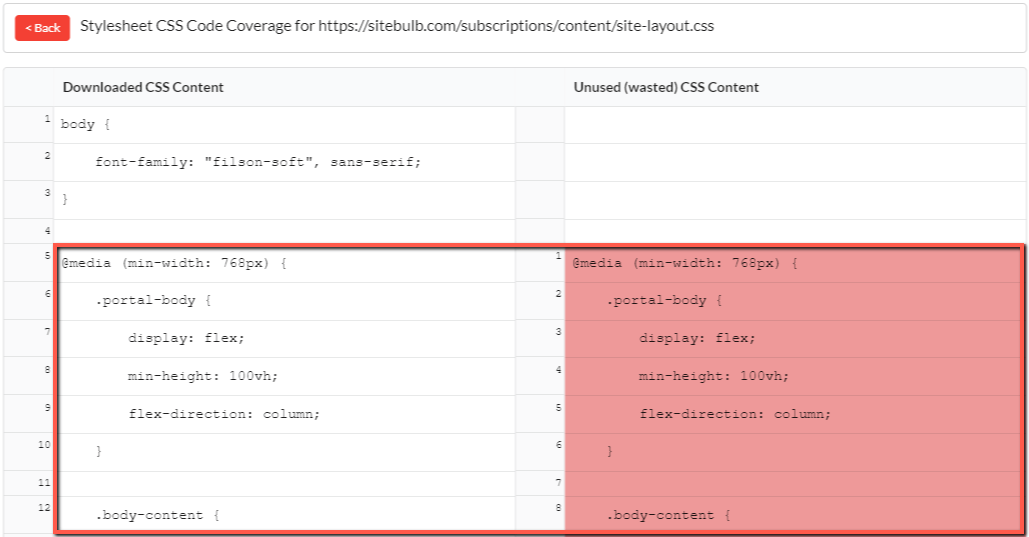
The tables contain information about every CSS and JS file found on your website with a margin of unused code. This report is similar to the code coverage report in Chrome’s dev tools, but the data is aggregated across the whole site, allowing you to audit more efficiently and find instances of ‘dead code’, where files are loaded but not used by any of your pages.
Content Coverage: This is data about the CSS or JS file itself.
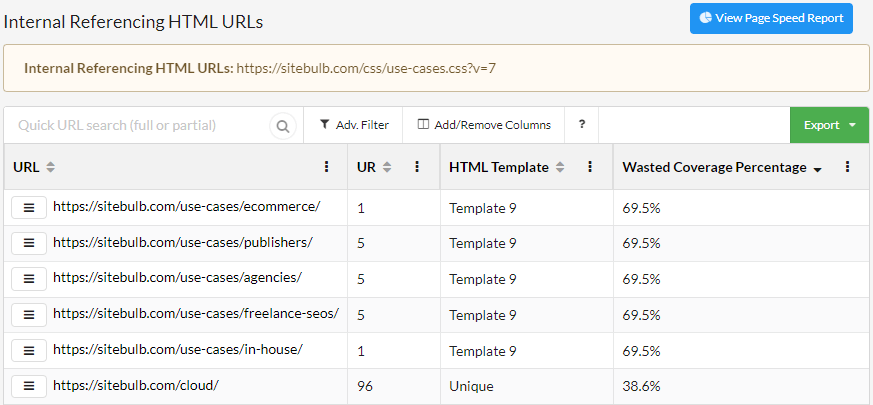
Incoming References: This data refers to the pages on which the script was loaded.
You can dig into the details for a particular script by using the burger menu to the left of the URLs.
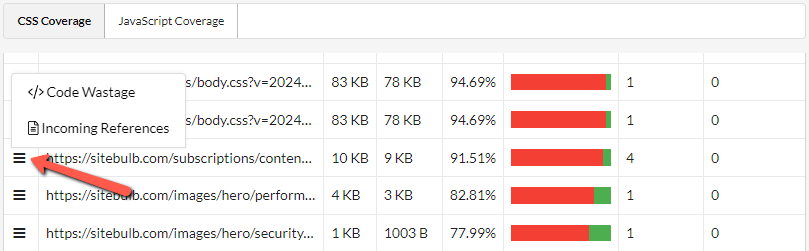
Here you’ll find two options:
As with every Sitebulb report, you have access to a variety of options for exporting and using this data. You can export the full CSS Coverage and JS Coverage data tables individually from the top of your Code Coverage overview.
Some JavaScript and CSS files may only be used for specific purposes which Sitebulb cannot emulate. For example, rendering following certain user actions, like interacting with a particular element on the page.
We recommend checking your code and its purpose in the browser before removing any of it, since Sitebulb may report wasted code in these particular cases where a file or part of it is not used in the initial page rendering.