


 Svet Petkov
We’re hugely grateful this week to Svet Petkov, who breaks down the recently-launched Chrome DevTool MCP and how it’s changing auditing Core Web Vitals forever.
For years, technical SEOs have relied on PageSpeed Insights (PSI) and other third-party tools to audit, and the CrUX Dashboard to monitor Core Web Vitals (CWV). But PSI alone is rarely enough. It offers a static snapshot that often misses how users actually experience a site, and its score can be more confusing than helpful.
Now that Google has replaced the Core Web Vitals CrUX Dashboard with CrUX Vis the question is what comes next?
Simple. Automation and personalisation. We are moving towards fast, AI-assisted audits that not only identify issues but also recommend clear, practical solutions. Chrome DevTools Model Context Protocol (MCP) allows SEOs to run performance traces, simulate user journeys, and debug CWV directly in a live browser, automatically and at scale.
And yes, fair warning that this article contains a lot of acronyms.
Contents:
What’s Broken in the Old Workflow
Traditional SEO performance audits rely on a handful of tools, such as GTMetrix, WebPageTest and Page Speed Insights. Each serves a purpose, but they still leave gaps.
They provide controlled, lab-based results. They’re consistent but artificial. Perfect conditions that rarely match what real users experience. Chrome User Experience Report (CrUX), on the other hand, delivers field data from real visitors (RUM data), but it can’t tell you why something is slow or what to fix first.
Two of all three (CLS and INP) metrics are session-based so they are more difficult to audit. Based on my experience, I think that is why for the last 1-2 years, the Chrome team has really improved the provided data in the Chrome DevTools for better auditing of the metrics by improving the Performance tab.
Even with all the data that Google is sharing, I still know technical SEOs who are using only PageSpeed Insights and are struggling to make clear recommendations.
That’s exactly where Chrome DevTools MCP comes in!
A quick refresh on what Core Web Vitals is
Before we dive in, let’s review the three key Core Web Vitals for SEO and user experience.
Largest Contentful Paint (LCP) - This shows how fast the main visible element, such as a hero image or headline, loads. Aim for under 2.5 seconds.
Interaction to Next Paint (INP) - This new INP metric replaces FID and measures how quickly a page responds to clicks, taps or key presses. Aim for 200 milliseconds or less.
Cumulative Layout Shift (CLS) - This measures visual stability. A CLS score of 0.1 or less means the page stays steady as ads, images or other elements load.
These three metrics are ranking factors (unless you’re stuck on page 10) and still matter for SEOs. But speed, stability, and responsiveness aren’t the only things that keep users engaged.
A great example of how performance impacts conversions is this FT.com case study.
For a deeper dive into Core Web Vitals, check out Patrick’s article: What SEOs Need to Know About Core Web Vitals & Performance Testing.
What is the Model Context Protocol (MCP)
The Model Context Protocol (MCP) is an open standard that lets AI tools like Claude, ChatGPT, and Gemini connect directly to external systems through a shared interface. Think of it as a universal adapter (like USB-C) that gives models real-time access to data, APIs, and applications.
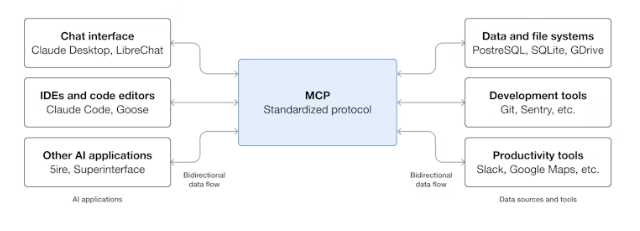
Source: Model Context Protocol
With MCP, your AI assistant can now “talk” to Chrome - not just read reports, but actually open your site, run performance tests, and simulate real user experiences.
For tech SEOs, this is a game-changer. Instead of relying on static tools, MCP shows what’s really happening in the browser: how fast content loads (LCP), how stable the page is (CLS), and how responsive it feels (INP).
In short, it turns Core Web Vitals auditing into real, automated, scalable practice.
What Tools You’ll Find in Chrome DevTools MCP
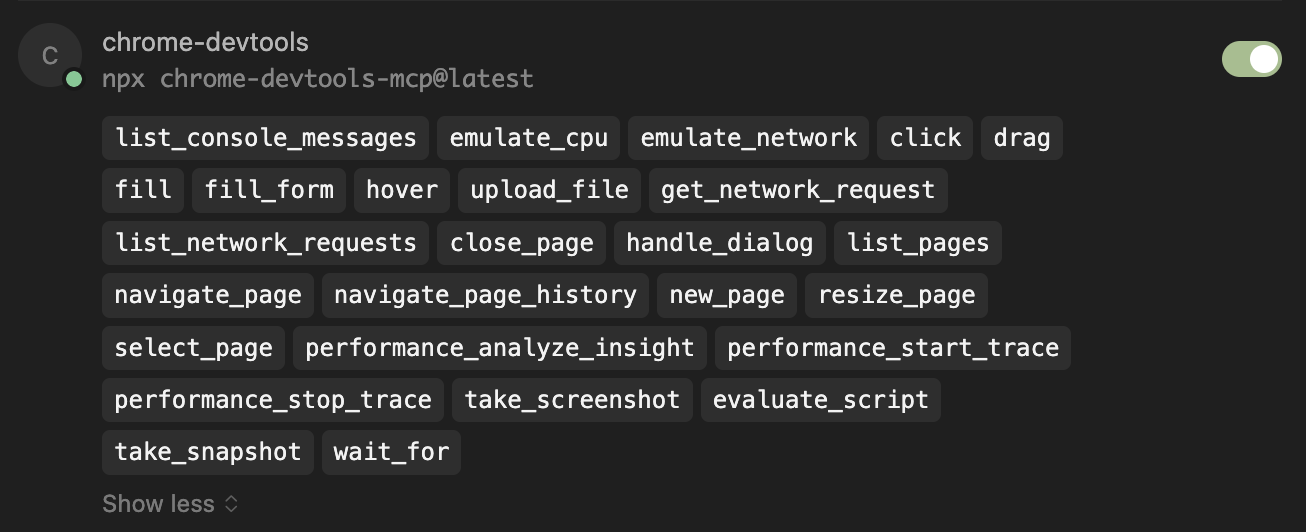
Each Model Context Protocol (MCP) includes tools that let AI agents interact with external systems — and the Chrome DevTools MCP is no exception.
Once connected, it gives your AI assistant programmatic access to the same debugging and automation tools developers use in Chrome.
You won’t need every tool available in the MCP, but here’s what’s included and what each group of tools does:
1. Input Automation
These tools let MCP interact with the page like a real user, ideal for simulating real-world behaviour when testing CWV.
click, drag, hover - Simulate user actions such as clicking buttons, dragging sliders, or hovering over menus.
fill, fill_form - Auto-fill text fields or complete forms to test INP or interaction-heavy pages.
upload_file - Upload files to forms or inputs.
handle_dialog - Manage pop-ups or confirmation boxes automatically.
2. Navigation Automation
Used to open, close, and manage browser pages during tests.
new_page, close_page, list_pages, select_page - Control multiple tabs and switch between them.
navigate_page, navigate_page_history - Load a specific URL or move back and forth in browser history.
wait_for - Pause until an element or network event appears, ensuring tests run at the right time.
3. Emulation Tools
Recreate realistic user environments for accurate testing.
emulate_network - Throttle connection speed and latency to mimic slow 3G, 4G, or offline modes.
emulate_cpu - Slow down processing to replicate lower-end mobile devices.
resize_page - Change viewport dimensions to simulate desktop, tablet, or mobile layouts.
4. Performance Tools
This is where MCP truly shines for SEOs - you can run and analyse Core Web Vitals in real time.
performance_start_trace - Start a Chrome performance trace to record everything happening as the page loads.
performance_stop_trace - Stop the trace once loaded. performance_analyze_insight - Automatically extract insights from the trace (e.g. high LCP, layout shifts, blocking scripts).
5. Network Tools
Inspect and diagnose network performance and third-party requests.
list_network_requests - List all network calls made during page load.
get_network_request - Retrieve details of a specific request (headers, response time, file size).
6. Debugging and Analysis
Analyse what’s happening inside the browser in real time.
list_console_messages - View errors, warnings, and logs from the browser console.
evaluate_script - Run snippets of JavaScript to test hypotheses or measure element timings.
take_screenshot, take_snapshot - Capture visual evidence of performance or layout issues.
Why Chrome DevTools MCP Changes the Game
Chrome DevTools MCP transforms the process by enabling real-time, dynamic debugging. It lets AI agents interact directly with a live browser — a major leap forward for web performance tools.
This means:
Running performance traces using tools like performance_start_trace, to capture exactly what happens as a page loads.
Analysing Core Web Vitals in live environments, rather than relying solely on lab data.
Simulating user interactions, such as filling out forms, clicking buttons, or scrolling, to uncover issues users would experience firsthand.
Surfacing bottlenecks such as network delays, layout shifts, and render-blocking scripts - precisely when and where they occur
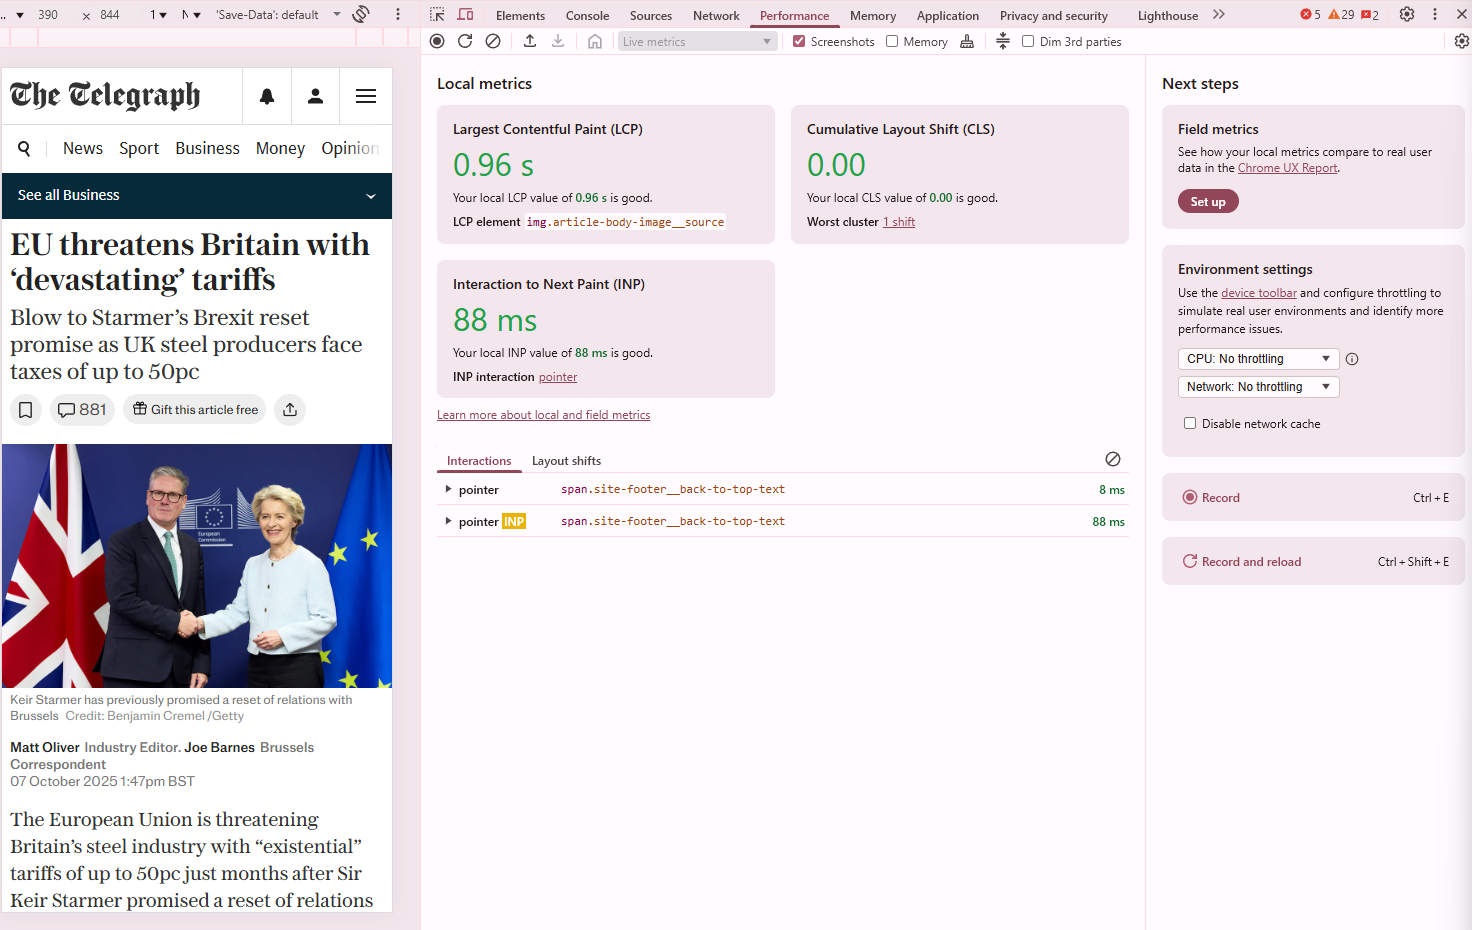
For example, if a page’s LCP exceeds 2.5 seconds, an AI-driven MCP audit can open the page in Chrome, record a trace, and pinpoint the issue — like an oversized hero image slowing it down.
Instead of generic “optimise images” advice, you get clear, actionable fixes: compress, preload, or use the priorityfetch attribute to reduce LCP.
How to audit CWV with Chrome DevTools MCP
So how do you actually put MCP to work in a CWV audit? Here’s a simple walkthrough.
1. Set up your MCP client
First, configure the Chrome DevTools MCP server in your preferred AI agent. Popular options include Gemini, Copilot, and Cursor.
I personally use and prefer Cursor or Claude Code, but you can also use it on Gemini CLI, which is a good, quick alternative, almost for free.
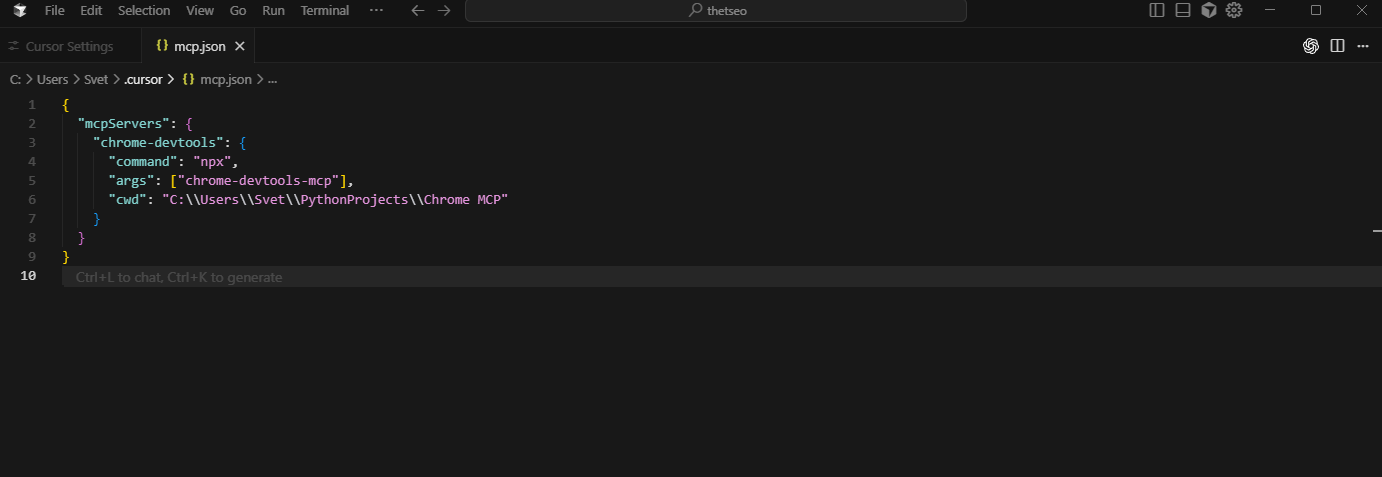
A basic configuration looks like this:
{
  "mcpServers": {
    "chrome-devtools": {
      "command": "npx",
      "args": ["chrome-devtools-mcp@latest"]
    }
  }
}
If you are not sure how to do it you can read this article about how to connect the MCP server on ChatGPT and this one for Claude.
2. Run your first CWV audit
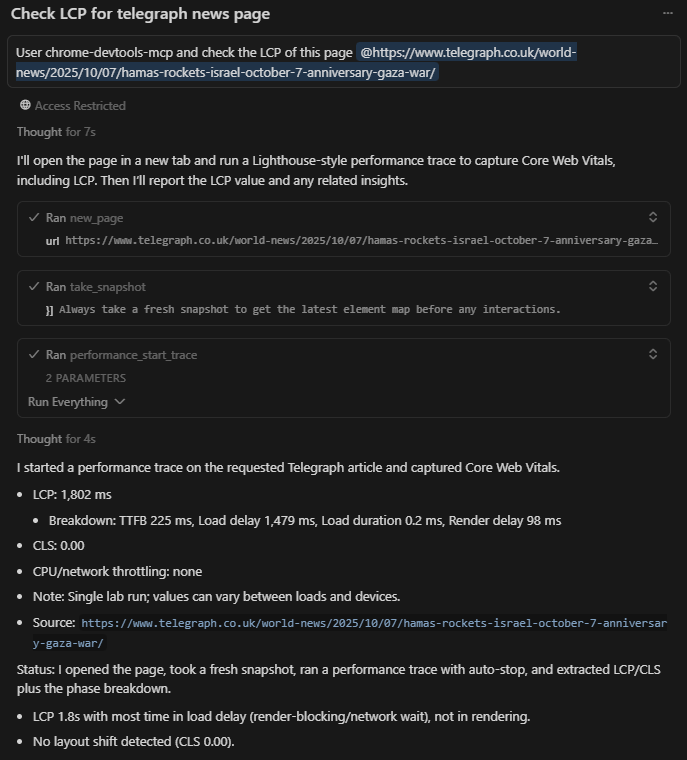
Once configured, you can just trigger your AI agent with a simple prompt as Google suggests:

Source: Chrome for Developers
Behind the scenes, MCP will:
Launch Chrome.
Open the page.
Record a performance trace.
Report back the values for LCP, CLS, and INP.
3. Interpret debugging insights
The real power of MCP is in the insights it delivers. Instead of vague advice, you get specific causes of poor performance. For example:
LCP bottleneck: A large hero image is loading too slowly. The MCP is identifying the LCP event and recommends the best solution such as preloading, compressing it, or if it’s missing, prefetchpriority set to high.
Poor INP: JavaScript long tasks are blocking the main thread-suggest breaking them up or deferring non-essential scripts.
High CLS: Third-party scripts (ads, widgets) are pushing content around-recommend reserving space with proper dimensions or using transform instead of layout changes.
With this level of detail, audits move from theory to practical, developer-ready action steps.
Advanced Use Cases for SEOs
Once you’ve mastered the basics, Chrome DevTools MCP enables far more powerful workflows than a simple CWV check.
Here are some advanced use cases I’ve found especially useful:
1. Improve the tool that you use
For more advanced features and using the MCP server for tools, I would recommend improving the MCP config, for example:
--headless=true → run Chrome in the background.
--isolated=true → keep tests clean by using a temporary browser profile(highly recommended).
--channel=canary → test against the latest Chrome features.
{
  "mcpServers": {
    "chrome-devtools": {
      "command": "npx",
      "args": [
        "chrome-devtools-mcp@latest",
        "--headless=true",
        "--isolated=true",
        "--channel=canary"
      ]
    }
  }
}
2. Automate bulk Core Web Vitals audits
Instead of manually testing each URL, you can have your AI agent automatically audit entire site sections (or page templates). MCP runs performance traces on every page, compiles the results, and sends updates via email or Slack. This saves hours of repetitive work and money.
3. Compare pre- and post-deployment performance
Running audits before and after releases helps catch regressions early. With MCP, you can compare real browser traces to confirm that code or design changes haven’t affected LCP, INP, or CLS — making performance reviews a seamless part of QA.
4. Simulate real-world conditions
As we all know, in the UK the mobile internet is not great and I always use tools like emulate_network (3G, 4G etc) and emulate_cpu (slow or fast CPU) to test how your site performs on slower connections or less powerful devices. This is invaluable for identifying bottlenecks that might not appear in your high-speed local tests.
5. Validate fixes automatically
Once you’ve applied optimisations, your AI agent can re-run the same audit to confirm improvements. For example, if you preload an image to fix a high LCP, the agent can immediately check whether it worked-closing the feedback loop in seconds.
Something cool that I would like to test is an agent connected with Jira MCP server and Chrome DevTools MCP to automate the check after every deployment and the changes that could affect the CWV.
What I’ve Learned from Working with the Chrome DevTools MCP Server
My Favourites
Always compare MCP results with field data MCP gives you deep, real-time insights, but remember: it’s still a controlled environment. Cross-check its findings with CrUX or your Real User Monitoring (RUM) data to ensure you’re fixing issues that actually impact real users.
Use consistent test conditions When running repeated audits, use the same device type, connection settings, and viewport size. Tools like emulate_network and emulate_cpu help standardise your tests so results remain comparable over time.
Automate but verify MCP’s automation features are powerful – you can schedule audits or re-tests after deployments – but always spot-check results. AI agents can sometimes misinterpret complex performance traces, especially on highly dynamic sites.
Great for “vibe-coding” One unexpected bonus is how useful MCP is for vibe-coding (in my case). It lets you read and analyse console messages directly, without having to copy and paste logs from your local environment. It’s a small detail, but it makes experimenting and debugging much smoother.
While You’re Using MCP, Keep This in Mind
Don’t treat MCP results as field data Lab and field results will never match perfectly. MCP helps you understand why CrUX or RUM shows certain results, but it doesn’t replace them.
Avoid testing only in ideal conditions Most users aren’t on powerful laptops with super-fast internet — especially on mobile here in the UK. Always test under slower connections or lower-performance settings to get a true picture of user experience.
Remember that every page is different Core Web Vitals can vary a lot between page types. Your homepage might score well, while product or article pages struggle. Use MCP to spot patterns across templates, not just single pages.
Keep your setup consistent If several people are using MCP in your team, make sure the configuration and flags are the same for everyone and stored in version control (like Git). This keeps your results reliable and easy to compare.
Be careful when running multiple sessions It’s possible to close all your open Chrome browsers by mistake (yes, it happened to me). Keep your testing environment separate from your daily browsing to avoid losing tabs or work in progress.
Final thoughts
The launch of the Chrome DevTools Model Context Protocol (MCP) is a major step forward for CWV and web performance. It closes the gap between manual audits and real-time analysis, allowing SEOs and developers to run live performance traces, simulate user journeys and debug issues directly in the browser.
More importantly, MCP opens the door to new creativity in web performance tooling. By giving AI direct access to Chrome’s debugging features, it allows us to build smarter, automated workflows that test, audit and optimise at scale.
This is not just another tool; it is the start of a new era where AI and DevTools work together to make performance optimisation faster, more accurate and far more innovative.
TL;DR
PageSpeed Insights and the CrUX Dashboard only show partial, static views of CWV.
Chrome DevTools MCP connects AI tools (like Gemini, Claude, or Copilot) directly to Chrome.
It runs performance traces, simulates user behaviour, and analyses CWV live.
Enables automated audits, pre- and post-deployment checks, and realistic mobile simulations.
Moves SEO from static reports to continuous, AI-powered performance optimisation.

Svet Petkov leads the Technical SEO team at The Telegraph, where they make complex systems faster, smarter, and easier to scale. His work focuses on improving site performance, refining workflows, and building tools that help teams make better data-driven decisions. With more than 10 years in technical SEO, he loves blending problem-solving, automation, and AI to turn data into practical insights and real impact.
Related Articles
 Agency Technical SEO in 2026: AMA with Tory Gray & Patrick Hathaway

 JavaScript SEO AMA with Sam Torres: 13 Questions & Answers


 Beyond the Basics: How to Turn Crawl Data Into Strategic Actionable SEO Insights

 Sitebulb Desktop
Find, fix and communicate technical issues with easy visuals, in-depth insights, & prioritized recommendations across 300+ SEO issues.
- Ideal for SEO professionals, consultants & marketing agencies.
 Sitebulb Cloud
Get all the capability of Sitebulb Desktop, accessible via your web browser. Crawl at scale without project, crawl credit, or machine limits.
- Perfect for collaboration, remote teams & extreme scale.