A full crawl is the right move when you want to understand a whole site. But when the question is about one URL – a homepage, a core money page, a competitor's product template – spinning up a whole audit might be overkill.
The Single Page Analysis tool renders a single page in real time and hands you the full technical analysis in moments. Paste the URL, click Check, done. It uses the Chrome Crawler, Sitebulb's user agent and a mobile device, so the page is analyzed the same way it would be in a full audit.
It's fast enough to use live, too. Pull up a prospect's page mid-call and talk through what you're seeing while they're still on the line.
When you run a check, Sitebulb works through all the same Hints checks it would in a full report, then lays everything out across a set of tabs:
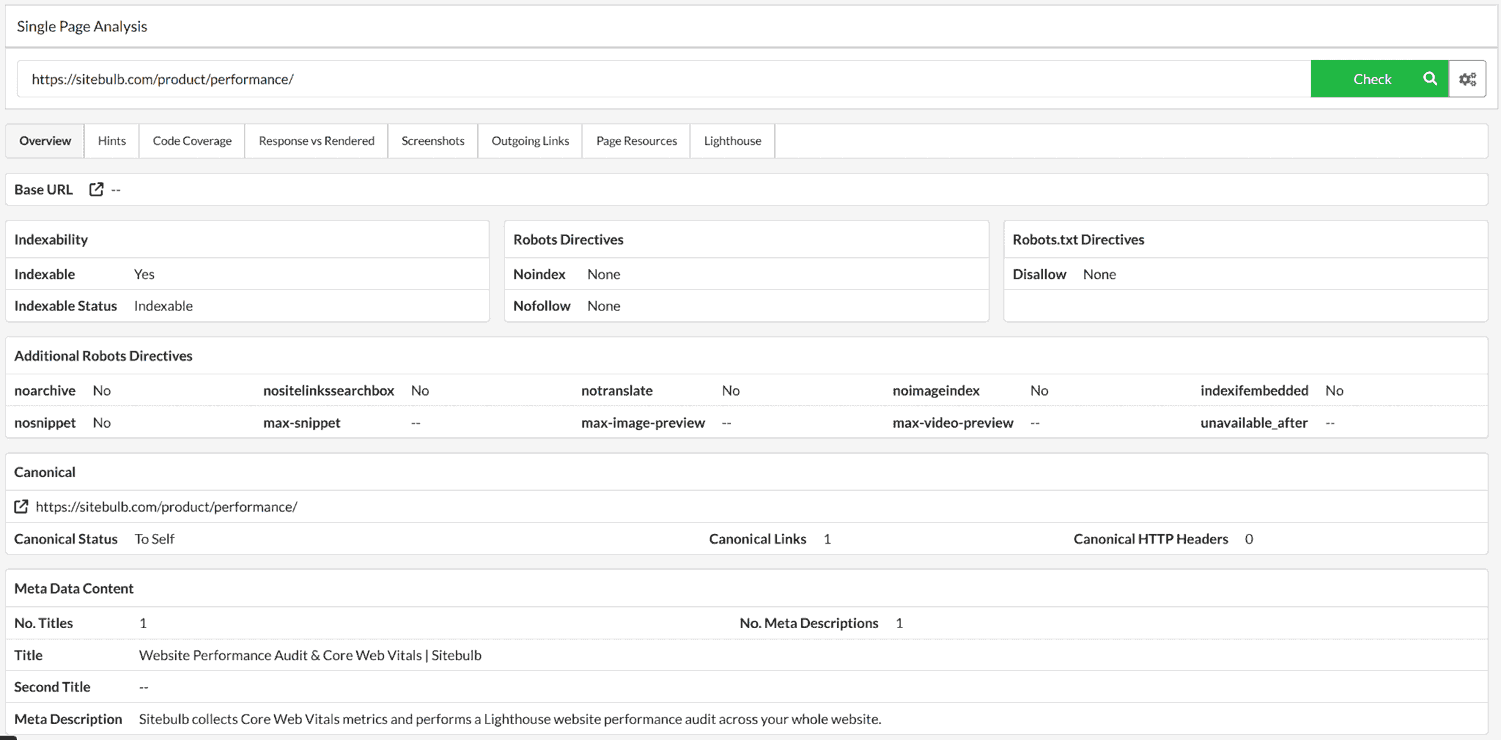
Overview: The headline data in one place: indexability, metadata and key on-page elements, technologies, Core Web Vitals and performance, the HTTP response and response headers, and international implementation.
Hints: Every issue flagged during the analysis of your URL, just as you'd see them in a full audit.
Code Coverage: How much of the CSS and JavaScript loaded by the page is actually used to render it, exactly like the main Code Coverage report.
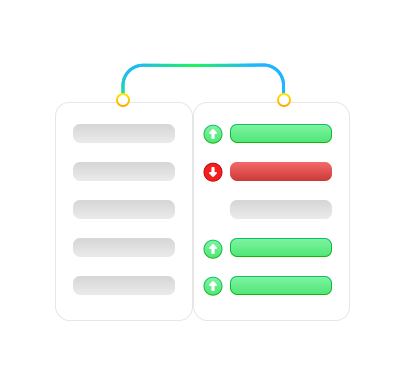
Response vs Render: A side-by-side comparison of the raw HTML response and the JavaScript-rendered DOM.
Screenshots: The rendered page on both desktop and mobile.
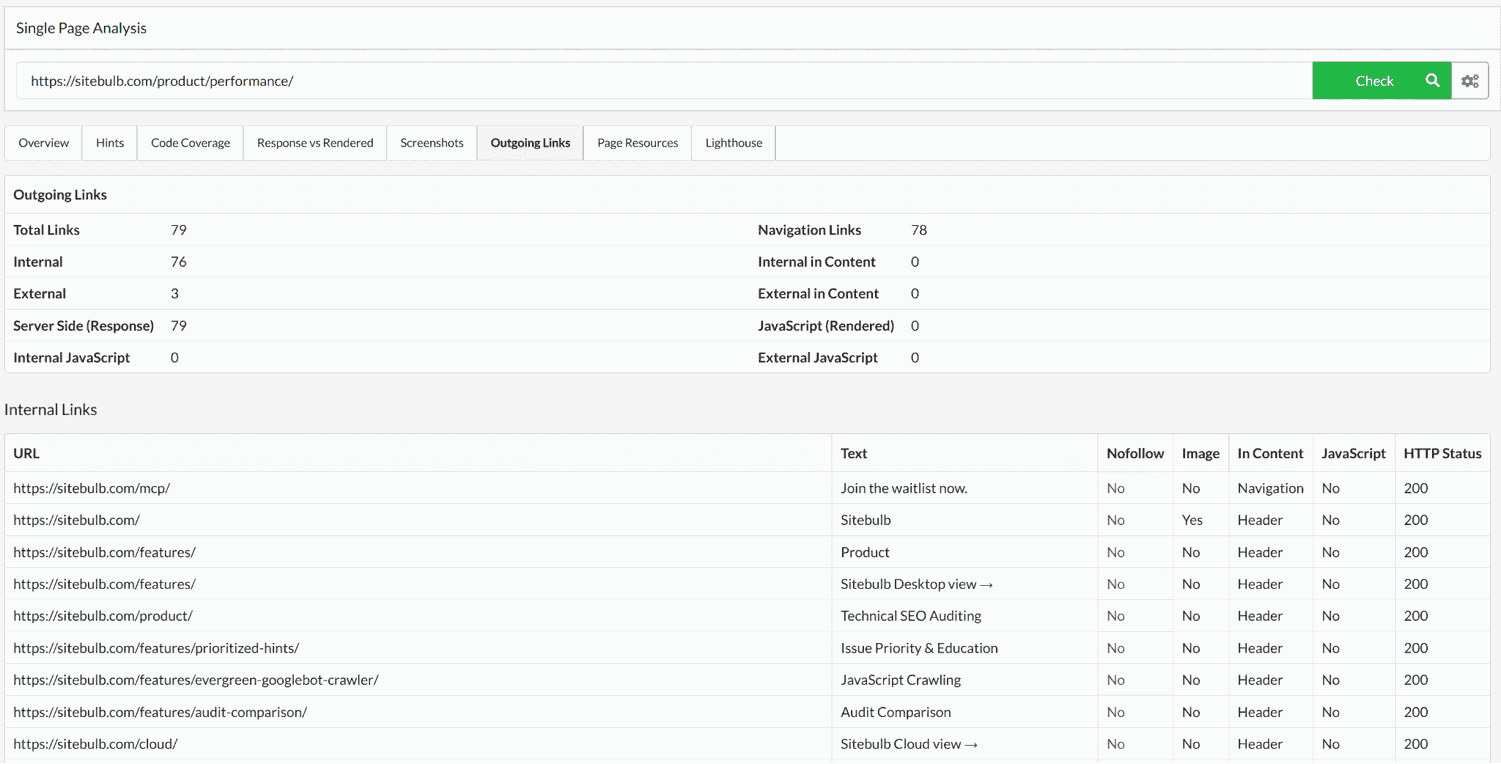
Outgoing Links: Every internal and external link on the page, with its supporting data.
Page Resources: An organized list of all stylesheets, JavaScript, fonts and images.
Lighthouse: Mobile and desktop scores, right next to all the other page data so you can cross-check performance against everything else.
Almost every site leans on JavaScript these days. Google increasingly renders it in the browser, and most LLMs can't render it at all, so the gap between your raw HTML and your rendered page is one of the most important things to understand about any URL.
The SPA's Response vs Render tab shows both side by side. Content modified by JavaScript is highlighted in orange, content added by JS in green, and anything removed by JS in red. So you can see at a glance whether elements like titles, canonicals, meta robots directives or internal links only show up after JavaScript runs. That's a common way for pages to fall out of the index without anyone noticing.
Drill into the differences across the DOM, Links, Images, Page Text and HTML. It's the Response vs Render report experience, focused on the single page in front of you.